| |||||||||||||||||||||||||||||||||||||
17 of the 51 seats to Derby City Council 26 seats needed for a majority | |||||||||||||||||||||||||||||||||||||
|---|---|---|---|---|---|---|---|---|---|---|---|---|---|---|---|---|---|---|---|---|---|---|---|---|---|---|---|---|---|---|---|---|---|---|---|---|---|
| |||||||||||||||||||||||||||||||||||||
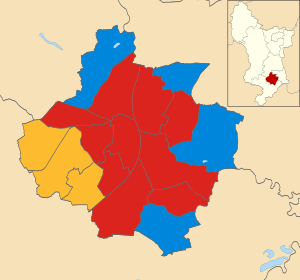
 Map showing the results of contested wards in the 2012 Derby City Council elections Map showing the results of contested wards in the 2012 Derby City Council elections | |||||||||||||||||||||||||||||||||||||
| |||||||||||||||||||||||||||||||||||||
The 2012 Derby City Council election took place on 3 May 2012 to elect members of Derby City Council in England. The Labour Party gained control of the council, which had previously been under No Overall Control.
Election results
| Party | Seats | Gains | Losses | Net gain/loss | Seats % | Votes % | Votes | +/− | |
|---|---|---|---|---|---|---|---|---|---|
| Labour | 10 | 6 | 0 | 58.8 | 44.7 | 24,982 | |||
| Conservative | 4 | 1 | 2 | 23.5 | 24.5 | 13,671 | |||
| Liberal Democrats | 3 | 0 | 5 | 17.6 | 20.6 | 11,529 | |||
| UKIP | 0 | 0 | 0 | 0.0 | 5.4 | 3,033 | New | ||
| Green | 0 | 0 | 0 | 0.0 | 3.0 | 1,667 | |||
| BNP | 0 | 0 | 0 | 0.0 | 1.8 | 1,031 | |||
All comparisons in vote share are to the corresponding 2008 election.
Ward results
Abbey

| Party | Candidate | Votes | % | |
|---|---|---|---|---|
| Labour | Sarah Elizabeth Russell | 1,330 | 46.3 | |
| Liberal Democrats | Rehmat Khan | 1,026 | 35.7 | |
| Conservative | John Cope | 284 | 9.9 | |
| Green | Tom Reading | 233 | 8.1 | |
| Turnout | ||||
| Labour gain from Liberal Democrats | ||||
Allestree

| Party | Candidate | Votes | % | |
|---|---|---|---|---|
| Conservative | Philip Hickson | 2,040 | 47.2 | |
| Labour | Helen McCartney Butcher | 1,289 | 29.8 | |
| UKIP | Martin Du Sautoy | 647 | 15.0 | |
| Liberal Democrats | Peter Barker | 179 | 4.1 | |
| Green | Jane Sarah Temple | 172 | 4.0 | |
| Turnout | ||||
| Conservative hold | ||||
Alvaston

| Party | Candidate | Votes | % | |
|---|---|---|---|---|
| Labour | Mark Stuart Tittley | 1,471 | 48.0 | |
| UKIP | Alan Wayne Graves | 1,007 | 32.8 | |
| Conservative | Alan Leslie Grimadell | 471 | 15.4 | |
| Liberal Democrats | John Edward Ahern | 119 | 3.9 | |
| Turnout | ||||
| Labour hold | ||||
Arboretum

| Party | Candidate | Votes | % | |
|---|---|---|---|---|
| Labour | Gulfraz Nawaz | 1,757 | 44.7 | |
| Liberal Democrats | Tullah Khan | 1,743 | 44.3 | |
| Green | Simon Hales | 248 | 6.3 | |
| Conservative | Ross McCristal | 186 | 4.7 | |
| Turnout | ||||
| Labour gain from Liberal Democrats | ||||
Blagreaves

| Party | Candidate | Votes | % | |
|---|---|---|---|---|
| Liberal Democrats | Joe Singh Naitta | 1,741 | 46.4 | |
| Labour | Michelle Joanne McFarlane | 1,569 | 41.8 | |
| Conservative | Edward Montgomery Ashford | 442 | 11.8 | |
| Turnout | ||||
| Liberal Democrats hold | ||||
Boulton

| Party | Candidate | Votes | % | |
|---|---|---|---|---|
| Labour | Alison Martin | 1,720 | 56.6 | |
| Conservative | Frank Leeming | 678 | 22.3 | |
| UKIP | Steve Fowke | 445 | 14.6 | |
| Green | David Foster | 123 | 4.0 | |
| Liberal Democrats | Kyle Martin | 75 | 2.5 | |
| Turnout | ||||
| Labour gain from Conservative | ||||
Chaddesden

| Party | Candidate | Votes | % | |
|---|---|---|---|---|
| Labour | Anne MacDonald | 1,689 | 54.2 | |
| Conservative | Steve Hassall | 836 | 26.8 | |
| BNP | Paul Hilliard | 459 | 14.7 | |
| Liberal Democrats | Ian Colin Deuchar Care | 134 | 4.3 | |
| Turnout | ||||
| Labour gain from Conservative | ||||
Chellaston

| Party | Candidate | Votes | % | |
|---|---|---|---|---|
| Conservative | Matthew Edward Holmes | 1,430 | 42.2 | |
| Labour | Paul Thomas Hezelgrave | 1,394 | 41.2 | |
| UKIP | Paul Andrew Randle | 458 | 13.5 | |
| Liberal Democrats | Nazir Hussain | 105 | 3.1 | |
| Turnout | ||||
| Conservative hold | ||||
Darley

| Party | Candidate | Votes | % | |
|---|---|---|---|---|
| Labour | Jack Stanton | 1,403 | 41.4 | |
| Conservative | John David Howard | 841 | 24.8 | |
| Liberal Democrats | Finbar Richards | 564 | 16.6 | |
| Green | David Clasby | 375 | 11.1 | |
| UKIP | Ian Edward Crompton | 205 | 6.0 | |
| Turnout | ||||
| Labour gain from Liberal Democrats | ||||
Derwent

| Party | Candidate | Votes | % | |
|---|---|---|---|---|
| Labour | Margaret Eileen Redfern | 1,314 | 51.6 | |
| Liberal Democrats | Richard Hudson | 689 | 27.1 | |
| BNP | Julie Fuller | 302 | 11.9 | |
| Conservative | Nicola Angela Roulstone | 239 | 9.4 | |
| Turnout | ||||
| Labour hold | ||||
Littleover

| Party | Candidate | Votes | % | |
|---|---|---|---|---|
| Liberal Democrats | Les Allen | 1,615 | 44.2 | |
| Labour | Simon Peter Parkes | 1,188 | 32.5 | |
| Conservative | Maxwell Arnold John Bradley Craven | 853 | 23.3 | |
| Turnout | ||||
| Liberal Democrats hold | ||||
Mackworth

| Party | Candidate | Votes | % | |
|---|---|---|---|---|
| Labour | Paul Pegg | 1,587 | 67.0 | |
| Conservative | Valerie Joan Taylor | 377 | 15.9 | |
| Green | Katy Cheatham | 231 | 9.8 | |
| Liberal Democrats | Catrin Sian Rutland | 174 | 7.3 | |
| Turnout | ||||
| Labour gain from Liberal Democrats | ||||
Mickleover

| Party | Candidate | Votes | % | |
|---|---|---|---|---|
| Liberal Democrats | Hilary Jane Jones | 1,807 | 40.3 | |
| Conservative | Alison Joyce Holmes | 1,481 | 33.0 | |
| Labour | Lester John Pendrey | 910 | 20.3 | |
| Green | Jean MacDonald | 285 | 6.4 | |
| Turnout | ||||
| Liberal Democrats hold | ||||
Normanton

| Party | Candidate | Votes | % | |
|---|---|---|---|---|
| Labour | Hardyal Singh Dhindsa | 2,092 | 61.0 | |
| Liberal Democrats | Muhammed Afsar | 1,035 | 30.2 | |
| Conservative | Hardial Singh Dhamrait | 8.9 | 305 | |
| Turnout | ||||
| Labour hold | ||||
Oakwood

| Party | Candidate | Votes | % | |
|---|---|---|---|---|
| Conservative | Frank Harwood | 1,348 | 47.7 | |
| Labour | Neil Wilson | 1,084 | 38.4 | |
| UKIP | Lee Allen | 276 | 9.8 | |
| Liberal Democrats | Roger Anthony Jackson | 116 | 4.1 | |
| Turnout | ||||
| Conservative gain from Liberal Democrats | ||||
Sinfin

| Party | Candidate | Votes | % | |
|---|---|---|---|---|
| Labour | Baggy Shanker | 1,880 | 78.1 | |
| Conservative | Arron Mathew Marsden | 273 | 11.3 | |
| Liberal Democrats | Kelly Anne Keenan | 254 | 10.6 | |
| Turnout | ||||
| Labour hold | ||||
Spondon

| Party | Candidate | Votes | % | |
|---|---|---|---|---|
| Conservative | Evonne Williams | 1,587 | 47.9 | |
| Labour | Steve Froggatt | 1,305 | 39.4 | |
| BNP | Vanessa Griffin | 270 | 8.1 | |
| Liberal Democrats | Simon Kirkman King | 153 | 4.6 | |
| Turnout | ||||
| Conservative hold | ||||
References
- "Local Election Results 2012". Andrew Teale.
- "Local Election Results 2012". Derby City Council.