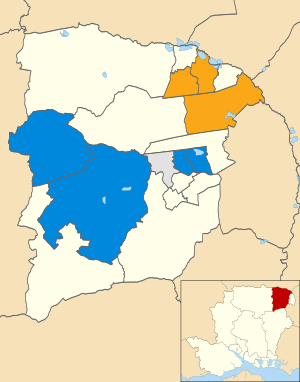
| |||||||||||||||||||||||||||||||||||||||||||||||||||||||||||
11 of 35 seats to Hart District Council 18 seats needed for a majority | |||||||||||||||||||||||||||||||||||||||||||||||||||||||||||
|---|---|---|---|---|---|---|---|---|---|---|---|---|---|---|---|---|---|---|---|---|---|---|---|---|---|---|---|---|---|---|---|---|---|---|---|---|---|---|---|---|---|---|---|---|---|---|---|---|---|---|---|---|---|---|---|---|---|---|---|
| |||||||||||||||||||||||||||||||||||||||||||||||||||||||||||
 Results by Ward Results by Ward | |||||||||||||||||||||||||||||||||||||||||||||||||||||||||||
| |||||||||||||||||||||||||||||||||||||||||||||||||||||||||||
The 2012 Hart District Council election took place on 3 May 2012 to elect members of the Hart District Council in England. This was the same day as other 2012 United Kingdom local elections.
Ward results
Blackwater and Hawley
| Party | Candidate | Votes | % | ±% | |
|---|---|---|---|---|---|
| Liberal Democrats | Brian Blewett | 645 | 62.6 | ||
| Conservative | Vivienne Gascoigne | 28- | 27.2 | ||
| Labour | Leslie Lawrie | 106 | 10.3 | ||
| Majority | 365 | ||||
| Turnout | 365 | ||||
| Liberal Democrats hold | Swing | ||||
Church Crookham East
| Party | Candidate | Votes | % | ±% | |
|---|---|---|---|---|---|
| CCH | James Radley | 976 | 81.7 | ||
| Conservative | Debbie Moss | 218 | 18.3 | ||
| Majority | 758 | ||||
| Turnout | 1,194 | ||||
| CCH hold | Swing | ||||
Crondall
| Party | Candidate | Votes | % | ±% | |
|---|---|---|---|---|---|
| CCH | Tony Clarke | 682 | 55.8 | ||
| Conservative | Nippy Singh | 541 | 44.2 | ||
| Majority | 141 | ||||
| Turnout | 1,223 | ||||
| CCH gain from Conservative | Swing | ||||
Fleet Central
| Party | Candidate | Votes | % | ±% | |
|---|---|---|---|---|---|
| Conservative | Akmal Gani | 724 | 48.0 | ||
| Independent | Denis Gotel | 621 | 41.2 | ||
| Labour | John Davies | 125 | 8.3 | ||
| Monster Raving Loony | Howling Laud Hope | 39 | 2.6 | ||
| Majority | 103 | ||||
| Turnout | 1,509 | ||||
| Conservative hold | Swing | ||||
Fleet Courtmoor
| Party | Candidate | Votes | % | ±% | |
|---|---|---|---|---|---|
| CCH | John Bennison | 799 | 52.5 | ||
| Conservative | Chris Butler | 614 | 40.3 | ||
| Labour | Ruth Williams | 110 | 7.2 | ||
| Majority | 185 | ||||
| Turnout | 1,523 | ||||
| CCH gain from Conservative | Swing | ||||
Fleet Pondtail
| Party | Candidate | Votes | % | ±% | |
|---|---|---|---|---|---|
| Conservative | Ian Lewis | 880 | 60.8 | ||
| Liberal Democrats | Paul Einchcomb | 421 | 29.1 | ||
| Independent | Satdeep Kaur Grewal | 147 | 10.2 | ||
| Majority | 459 | ||||
| Turnout | 1,448 | ||||
| Conservative hold | Swing | ||||
Fleet West
| Party | Candidate | Votes | % | ±% | |
|---|---|---|---|---|---|
| Independent | Alan Oliver | 1,481 | 80.4 | ||
| Conservative | Tim Davies | 362 | 19.6 | ||
| Majority | 1,119 | ||||
| Turnout | 1,843 | ||||
| Independent gain from Conservative | Swing | ||||
Hook
| Party | Candidate | Votes | % | ±% | |
|---|---|---|---|---|---|
| Conservative | Mike Morris | 1,251 | 72.1 | ||
| Labour | Verd Nabbs | 340 | 19.6 | ||
| Liberal Democrats | Andy Whitaker | 145 | 8.4 | ||
| Majority | 1,591 | ||||
| Turnout | 1,736 | ||||
| Conservative hold | Swing | ||||
Odiham
| Party | Candidate | Votes | % | ±% | |
|---|---|---|---|---|---|
| Conservative | Stephen Gorys | 888 | 76.5 | ||
| Liberal Democrats | Anthony Over | 273 | 23.5 | ||
| Majority | 615 | ||||
| Turnout | 1,161 | ||||
| Conservative hold | Swing | ||||
Yateley East
| Party | Candidate | Votes | % | ±% | |
|---|---|---|---|---|---|
| Liberal Democrats | Stuart Bailey | 789 | 68.0 | ||
| Conservative | Edward Bromhead | 271 | 23.3 | ||
| Labour | Midge Broadley | 101 | 8.7 | ||
| Majority | 518 | ||||
| Turnout | 1,161 | ||||
| Liberal Democrats hold | Swing | ||||
Yateley West
| Party | Candidate | Votes | % | ±% | |
|---|---|---|---|---|---|
| Liberal Democrats | Mark Murphy | 646 | 54.5 | ||
| Conservative | Richard Woods | 347 | 29.3 | ||
| Labour | Joyce Still | 193 | 16.3 | ||
| Majority | 993 | ||||
| Turnout | 1,186 | ||||
| Liberal Democrats hold | Swing | ||||
References
- "Local elections 2012". BBC News. Retrieved 30 April 2012.
- "Local Elections Archive Project - 2012 - Hart". www.andrewteale.me.uk. Retrieved 22 September 2020.
- "District and Parish Results 2012: Election Results for 3 May 2012" (PDF).