| |||||||||||||||||||||||||||||||||||||||||||||||||||||||||||||||||||||||||||||
All 100 seats in the House of Representatives 51 seats needed for a majority | |||||||||||||||||||||||||||||||||||||||||||||||||||||||||||||||||||||||||||||
| Turnout | 91.35% | ||||||||||||||||||||||||||||||||||||||||||||||||||||||||||||||||||||||||||||
|---|---|---|---|---|---|---|---|---|---|---|---|---|---|---|---|---|---|---|---|---|---|---|---|---|---|---|---|---|---|---|---|---|---|---|---|---|---|---|---|---|---|---|---|---|---|---|---|---|---|---|---|---|---|---|---|---|---|---|---|---|---|---|---|---|---|---|---|---|---|---|---|---|---|---|---|---|---|
| |||||||||||||||||||||||||||||||||||||||||||||||||||||||||||||||||||||||||||||
| Part of the Politics series |
| Politics of the Netherlands |
|---|
 |
| Constitution |
| Monarchy |
| Cabinet |
| States General |
| Judiciary |
| Elections |
| Local government |
| Foreign relations |
| Related topics |
|
|
General elections were held in the Netherlands on 1 July 1925. The General League of Roman Catholic Electoral Associations remained the largest party in the House of Representatives, winning 30 of the 100 seats.
Results

 | |||||
|---|---|---|---|---|---|
| Party | Votes | % | Seats | +/– | |
| General League | 883,333 | 28.63 | 30 | –2 | |
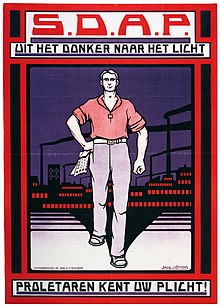
| Social Democratic Workers' Party | 706,689 | 22.90 | 24 | +4 | |
| Anti-Revolutionary Party | 377,426 | 12.23 | 13 | –3 | |
| Christian Historical Union | 305,587 | 9.90 | 11 | 0 | |
| Liberal State Party | 269,564 | 8.74 | 9 | –1 | |
| Free-thinking Democratic League | 187,183 | 6.07 | 7 | +2 | |
| Reformed Political Party | 62,513 | 2.03 | 2 | +1 | |
| Peasants' League | 43,877 | 1.42 | 1 | –1 | |
| Communist Party Holland | 36,770 | 1.19 | 1 | –1 | |
| Roman Catholic People's Party | 36,571 | 1.19 | 1 | New | |
| Hervormd Gereformeerde Staatspartij | 30,258 | 0.98 | 1 | +1 | |
| Middle Class Party | 23,176 | 0.75 | 0 | 0 | |
| Peasants' League–De Boer | 18,762 | 0.61 | 0 | New | |
| Protestant People's Party | 15,499 | 0.50 | 0 | 0 | |
| Christian Democratic Federation | 13,944 | 0.45 | 0 | 0 | |
| Revolutionary Work Committee | 12,655 | 0.41 | 0 | New | |
| Patriotic Party | 12,597 | 0.41 | 0 | 0 | |
| Socialist Party | 11,790 | 0.38 | 0 | 0 | |
| Democratic Party | 11,102 | 0.36 | 0 | 0 | |
| Rapaille Partij | 4,697 | 0.15 | 0 | 0 | |
| Austerity League | 4,655 | 0.15 | 0 | 0 | |
| Sport Party | 4,402 | 0.14 | 0 | New | |
| Free Thinkers | 3,649 | 0.12 | 0 | 0 | |
| Union of Actualists | 2,253 | 0.07 | 0 | New | |
| Party for Pension Interests | 1,945 | 0.06 | 0 | 0 | |
| Land Party | 1,868 | 0.06 | 0 | 0 | |
| Agricultural Party | 1,150 | 0.04 | 0 | New | |
| New National Party | 757 | 0.02 | 0 | New | |
| Union for Contributory State Pension | 556 | 0.02 | 0 | 0 | |
| Wild Party | 294 | 0.01 | 0 | New | |
| Rentetrekkers | 206 | 0.01 | 0 | New | |
| Free-thinkers Christian Party | 134 | 0.00 | 0 | New | |
| Total | 3,085,862 | 100.00 | 100 | 0 | |
| Valid votes | 3,085,862 | 95.34 | |||
| Invalid/blank votes | 150,729 | 4.66 | |||
| Total votes | 3,236,591 | 100.00 | |||
| Registered voters/turnout | 3,543,058 | 91.35 | |||
| Source: Nederlandse verkiezingsuitslagen | |||||
See also
References
- Dieter Nohlen & Philip Stöver (2010) Elections in Europe: A data handbook, p1395 ISBN 978-3-8329-5609-7
- Nohlen & Stöver, p1412
- "Tweede-Kamerverkiezingen 1 juli 1925". Nederlandse verkiezingsuitslagen 1918-nu.