
Economics, business, accounting, and related fields often distinguish between quantities that are stocks and those that are flows. These differ in their units of measurement. A stock is measured at one specific time, and represents a quantity existing at that point in time (say, December 31, 2004), which may have accumulated in the past. A flow variable is measured over an interval of time. Therefore, a flow would be measured per unit of time (say a year). Flow is roughly analogous to rate or speed in this sense.
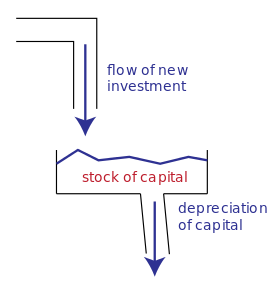
For example, U.S. nominal gross domestic product refers to a total number of dollars spent over a time period, such as a year. Therefore, it is a flow variable, and has units of dollars/year. In contrast, the U.S. nominal capital stock is the total value, in dollars, of equipment, buildings, and other real productive assets in the U.S. economy, and has units of dollars. The diagram provides an intuitive illustration of how the stock of capital currently available is increased by the flow of new investment and depleted by the flow of depreciation.
Stocks and flows in accounting
Thus, a stock refers to the value of an asset at a balance date (or point in time), while a flow refers to the total value of transactions (sales or purchases, incomes or expenditures) during an accounting period. If the flow value of an economic activity is divided by the average stock value during an accounting period, we obtain a measure of the number of turnovers (or rotations) of a stock in that accounting period. Some accounting entries are normally always represented as a flow (e.g. profit or income), while others may be represented both as a stock or as a flow (e.g. capital).
A person or country might have stocks of money, financial assets, liabilities, wealth, real means of production, capital, inventories, and human capital (or labor power). Flow magnitudes include income, spending, saving, debt repayment, fixed investment, inventory investment, and labor utilization. These differ in their units of measurement. Capital is a stock concept which yields a periodic income which is a flow concept.
Comparing stocks and flows
Further information: Dimensional analysis § CommensurabilityStocks and flows have different units and are thus not commensurable – they cannot be meaningfully compared, equated, added, or subtracted. However, one may meaningfully take ratios of stocks and flows, or multiply or divide them. This is a point of some confusion for some economics students, as some confuse taking ratios (valid) with comparing (invalid).
The ratio of a stock over a flow has units of (units)/(units/time) = time. For example, the debt to GDP ratio has units of years (as GDP is measured in, for example, dollars per year whereas debt is measured in dollars), which yields the interpretation of the debt to GDP ratio as "number of years to pay off all debt, assuming all GDP devoted to debt repayment".
The ratio of a flow to a stock has units 1/time. For example, the velocity of money is defined as nominal GDP / nominal money supply; it has units of (dollars / year) / dollars = 1/year.
In discrete time, the change in a stock variable from one point in time to another point in time one time unit later (the first difference of the stock) is equal to the corresponding flow variable per unit of time. For example, if a country's stock of physical capital on January 1, 2010 is 20 machines and on January 1, 2011 is 23 machines, then the flow of net investment during 2010 was 3 machines per year. If it then has 27 machines on January 1, 2012, the flow of net investment during 2010 and 2011 averaged machines per year.
In continuous time, the time derivative of a stock variable is a flow variable.
More general uses
Main article: System dynamicsStocks and flows also have natural meanings in many contexts outside of economics, business and related fields. The concepts apply to many conserved quantities such as energy, and to materials such as in stoichiometry, water reservoir management, and greenhouse gases and other durable pollutants that accumulate in the environment or in organisms. Climate change mitigation, for example, is a fairly straightforward stock and flow problem with the primary goal of reducing the stock (the concentration of durable greenhouse gases in the atmosphere) by manipulating the flows (reducing inflows such as greenhouse gas emissions into the atmosphere, and increasing outflows such as carbon dioxide removal). In living systems, such as the human body, energy homeostasis describes the linear relationship between flows (the food we eat and the energy we expend along with the wastes we excrete) and the stock (manifesting as our gain or loss of body weight over time). In Earth system science, many stock and flow problems arise, such as in the carbon cycle, the nitrogen cycle, the water cycle, and Earth's energy budget. Thus stocks and flows are the basic building blocks of system dynamics models. Jay Forrester originally referred to them as "levels" rather than stocks, together with "rates" or "rates of flow".
A stock (or "level variable") in this broader sense is some entity that is accumulated over time by inflows and/or depleted by outflows. Stocks can only be changed via flows. Mathematically a stock can be seen as an accumulation or integration of flows over time – with outflows subtracting from the stock. Stocks typically have a certain value at each moment of time – e.g. the number of population at a certain moment, or the quantity of water in a reservoir.
A flow (or "rate") changes a stock over time. Usually we can clearly distinguish inflows (adding to the stock) and outflows (subtracting from the stock). Flows typically are measured over a certain interval of time – e.g., the number of births over a day or month.
Synonyms
| Stock | Flow |
| Level | Rate |
| Integral | Derivative |
| State Variable |
Examples
Accounting, finance, etc.
| "Stock" | Possible units of stock | "Inflow(s)" | "Outflow(s)" | Possible units of flow |
| bank balance | yen | deposits interest |
withdrawals | yen per month |
| inventory of lumber | board feet | incoming lumber | outgoing lumber | board feet per week |
| housing stock | dollars | housing investment | housing depreciation | dollars per year |
| equity shareholdings | shares (of 'stock') | purchases of shares | sales of shares | shares per month |
Other contexts
| "Stock" | Possible units of stock | "Inflow(s)" | "Outflow(s)" | Possible units of flow |
| CO2 in atmosphere | tons | tons emitted | tons sequestered | tons per day |
| guests in a hotel | persons | guests arriving | guests leaving | persons per day |
| population | persons | births immigration |
deaths emigration |
persons per year |
| water in bathtub | liters | water pouring in | water draining out | liters per second |
| waste in disposal site | tons | dumping waste | decay of waste | tons per week |
| fuel tank | gallons | refueling | fuel consumption | gallons per month |
Calculus interpretation
If the quantity of some stock variable at time is , then the derivative is the flow of changes in the stock. Likewise, the stock at some time is the integral of the flow from some moment set as zero until time .
For example, if the capital stock is increased gradually over time by a flow of gross investment and decreased gradually over time by a flow of depreciation , then the instantaneous rate of change in the capital stock is given by
where the notation refers to the flow of net investment, which is the difference between gross investment and depreciation.
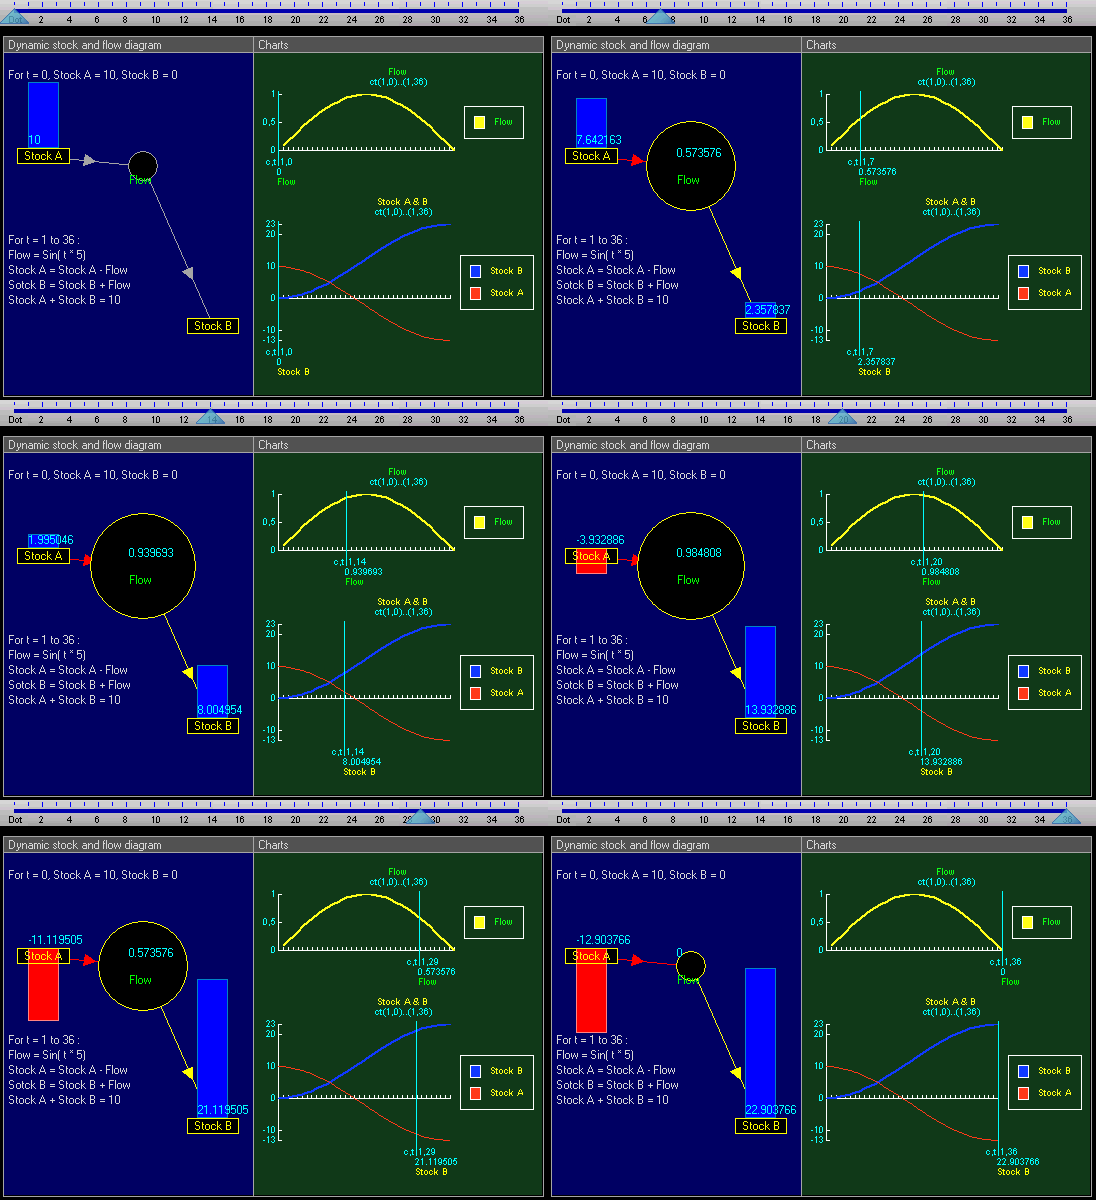
Example of dynamic stock and flow diagram


Equations that change the two stocks via the flow are:
List of all the equations, in their order of execution in each time, from time = 1 to 36:
History
The distinction between a stock and a flow variable is elementary, and dates back centuries in accounting practice (distinction between an asset and income, for instance). In economics, the distinction was formalized and terms were set in (Fisher 1896), in which Irving Fisher formalized capital (as a stock).
Polish economist Michał Kalecki emphasized the centrality of the distinction of stocks and flows, caustically calling economics "the science of confusing stocks with flows" in his critique of the quantity theory of money (circa 1936, frequently quoted by Joan Robinson).
See also
- Flow (disambiguation)
- Intensive and extensive properties
- Stock (disambiguation)
- Stock-Flow consistent model
- Systems thinking
- System dynamics
- Wealth (economics)
References
- Forrester, Jay (1973). World Dynamics (2 ed.). Cambridge, Massachusetts: Wright-Allen Press, Inc. pp. 18–19.
- Joan Robinson, "Shedding Darkness", Cambridge Journal of Economics, 6 (1982), 295–6: "it is the science of confusing stocks with flows. It is this confusion that has kept the Quantity Theory of Money alive until today."
- Fisher, Irving (December 1896), "What is Capital?", The Economic Journal, 6 (24): 509–534, doi:10.2307/2957184, JSTOR 2957184
- D.W. Bushaw and R.W. Clower, 1957. Introduction to Mathematical Economics, Ch. 3–6. "Section" & arrow-searchable pageChapter ("Section") and arrow-searchable page links.
- Robert W. Clower, 1954a. "An Investigation into the Dynamics of Investment," American Economic Review. 44(l), pp. 64–81.
- _____, 1954b. "Price Determination in a Stock-Flow Economy" with D. W. Bushaw, Econometrica 22(3), p p. 328–343.
- _____, 1968. "Stock-flow analysis," International Encyclopedia of the Social Sciences, v. 12.
- Glenn W. Harrison, 1987 . "Stocks and flows," The New Palgrave: A Dictionary of Economics, v. 4, pp. 506–09.
 machines per year.
 is
is  , then the
  is the flow of changes in the stock. Likewise, the stock at some time
  is the
  is increased gradually over time by a flow of
  and decreased gradually over time by a flow of
  , then the instantaneous rate of change in the capital stock is given by

 refers to the flow of


