(Redirected from United States House of Representatives elections in North Carolina, 2006 )
The United States House of Representative elections of 2006 in North Carolina were held on 7 November 2006 as part of the biennial election to the United States House of Representatives . All thirteen seats in North Carolina, and 435 nationwide, were elected.
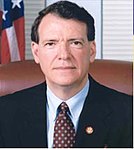
The Democrats gained a seat, becoming the largest party in terms of both representatives and popular vote . All incumbents ran again, with twelve of the thirteen winning re-election. Republican incumbent Charles H. Taylor lost the 11th district , while fellow Republican Robin Hayes came close to losing in the 8th .
It is not to be confused with the election to the North Carolina House of Representatives , which was held on the same day.
Summary
2006 United States House of Representative elections in North Carolina – Summary
Party
Seats
Gains
Losses
Net gain/loss
Seats %
Votes %
Votes
+/−
Democratic
7
1
0
+1
53.85
52.91
1,026,915
+3.98
Republican
6
0
1
–1
46.15
47.09
913,893
–3.98
District 1
2006 United States House of Representatives North Carolina 1st District election
Party
Candidate
Votes
%
±%
Democratic
G. K. Butterfield 82,510
100.00
+36.26
Turnout
82,510
District 2
District 3
District 4
District 5
District 6
District 7
District 8
District 9
District 10
District 11
2006 North Carolina's 11th congressional district election
Shuler: 50−60% 60−70% Taylor: 50−60%
Incumbent Republican Charles H. Taylor faced Democrat Heath Shuler . On election night Shuler defeated Taylor by 7.6%.
District 12
District 13
2006 United States House of Representatives North Carolina 13th District election
Party
Candidate
Votes
%
±%
Democratic
Brad Miller 98,540
63.71
+4.92
Republican
Vernon Robinson
56,120
36.29
–4.92
Turnout
154,660
Footnotes
"2006 General Election Results US House (1st District)" . North Carolina State Board of Elections. Retrieved January 11, 2010."2006 General Election Results US House (2nd District)" . North Carolina State Board of Elections. Retrieved January 11, 2010."2006 General Election Results US House (3rd District)" . North Carolina State Board of Elections. Retrieved January 11, 2010."2006 General Election Results US House (4th District)" . North Carolina State Board of Elections. Retrieved January 11, 2010."2006 General Election Results US House (5th District)" . North Carolina State Board of Elections. Retrieved January 11, 2010."2006 General Election Results US House (6th District)" . North Carolina State Board of Elections. Retrieved January 11, 2010."2006 General Election Results US House (7th District)" . North Carolina State Board of Elections. Retrieved January 11, 2010."2006 General Election Results US House (8th District)" . North Carolina State Board of Elections. Retrieved January 11, 2010."2006 General Election Results US House (9th District)" . North Carolina State Board of Elections. Retrieved January 11, 2010."2006 General Election Results US House (10th District)" . North Carolina State Board of Elections. Retrieved January 11, 2010."2006 General Election Results US House (11th District)" . North Carolina State Board of Elections. Retrieved January 11, 2010."2006 General Election Results US House (12th District)" . North Carolina State Board of Elections. Retrieved January 11, 2010."2006 General Election Results US House (13th District)" . North Carolina State Board of Elections. Retrieved January 11, 2010.
(2005 ← ) 2006 United States elections (→ 2007 ) U.S.
U.S. election )
Governors
State Attorneys General
State officials
State
Mayors
Anaheim, CA Anchorage, AK Austin, TX Fort Lauderdale, FL Irvine, CA Long Beach, CA Newark, NJ New Orleans, LA Richmond, CA San Bernardino, CA San Jose, CA Norfolk, VA Oakland, CA Providence, RI Santa Ana, CA Tallahassee, FL Tulsa, OK Washington, DC States
Categories :
Text is available under the Creative Commons Attribution-ShareAlike License. Additional terms may apply.
**DISCLAIMER** We are not affiliated with Wikipedia, and Cloudflare.
The information presented on this site is for general informational purposes only and does not constitute medical advice.
You should always have a personal consultation with a healthcare professional before making changes to your diet, medication, or exercise routine.
AI helps with the correspondence in our chat.
We participate in an affiliate program. If you buy something through a link, we may earn a commission 💕
↑

 County results

