| ||||||||||||||||||||||||||||
All 3 West Virginia seats to the United States House of Representatives | ||||||||||||||||||||||||||||
|---|---|---|---|---|---|---|---|---|---|---|---|---|---|---|---|---|---|---|---|---|---|---|---|---|---|---|---|---|
| ||||||||||||||||||||||||||||
 Election results by district Election results by district Election results by county Election results by county
| ||||||||||||||||||||||||||||
The 2006 United States House of Representatives elections in West Virginia were held on November 7, 2006, to determine who will represent the state of West Virginia in the United States House of Representatives. West Virginia has three seats in the House, apportioned according to the 2000 United States census. Representatives are elected for two-year terms.
Overview
| United States House of Representatives elections in West Virginia, 2006 | |||||
|---|---|---|---|---|---|
| Party | Votes | Percentage | Seats | +/– | |
| Democratic | 263,822 | 58.01% | 2 | — | |
| Republican | 190,893 | 41.97% | 1 | — | |
| Independents | 98 | 0.02% | 0 | — | |
| Totals | 454,813 | 100.00% | 3 | — | |
District 1
| ← 20042008 → | |||||||||||||||||
| |||||||||||||||||
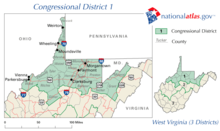
 Results by county Results by countyMollohan: 50–60% 60–70% 70–80% Wakim: 50–60% | |||||||||||||||||
| |||||||||||||||||

Incumbent Democrat Alan Mollohan defeated Republican Chris Wakim, a state delegate. This district covers the northern part of the state.
| Party | Candidate | Votes | % | |
|---|---|---|---|---|
| Democratic | Alan Mollohan (incumbent) | 100,939 | 64.29 | |
| Republican | Chris Wakim | 55,963 | 35.65 | |
| Write-ins | 98 | 0.06 | ||
| Total votes | 157,000 | 100.00 | ||
| Democratic hold | ||||
District 2

Incumbent Republican Shelley Moore Capito defeated Democrat Mike Callaghan, a U.S. Attorney. This district covers the central part of the state.
| Party | Candidate | Votes | % | |
|---|---|---|---|---|
| Republican | Shelley Moore Capito (incumbent) | 94,110 | 57.18 | |
| Democratic | Mike Callaghan | 70,470 | 42.82 | |
| Total votes | 164,580 | 100.00 | ||
| Republican hold | ||||
District 3

Incumbent Democrat Nick Rahall defeated Republican Kim Wolfe, the Sheriff of Cabell County. This district covers the southern part of the state.
| Party | Candidate | Votes | % | |
|---|---|---|---|---|
| Democratic | Nick Rahall (incumbent) | 92,413 | 69.36 | |
| Republican | Kim Wolfe | 40,820 | 30.64 | |
| Total votes | 133,233 | 100.00 | ||
| Democratic hold | ||||
References
- "Office of the Clerk, U.S. House of Representatives". clerk.house.gov.
| (2005 ←) 2006 United States elections (→ 2007) | |
|---|---|
| U.S. Senate |
|
| U.S. House (election ratings) |
|
| Governors |
|
| State Attorneys General | |
| State officials | |
| State legislatures |
|
| Mayors | |
| States |
|


