Main article: 2008 United States presidential election
| ||||||||||||||||||||||||||
| ||||||||||||||||||||||||||
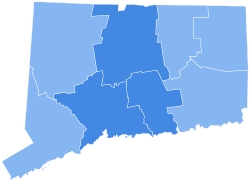
 County Results
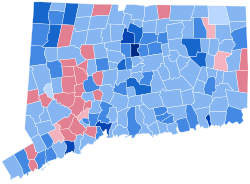
 Municipality Results
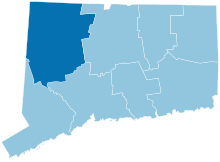
 Congressional District Results
| ||||||||||||||||||||||||||
| ||||||||||||||||||||||||||
The 2008 United States presidential election in Connecticut took place on November 4, 2008, and was part of the 2008 United States presidential election. Voters chose seven representatives, or electors to the Electoral College, who voted for president and vice president.
Connecticut was won by Democratic nominee Barack Obama with a 22.4% margin of victory. Connecticut was one of the six states that had every county—including traditionally Republican Litchfield County—go for Obama, the others being Hawaii, Massachusetts, New Hampshire, Rhode Island, and Vermont. Connecticut has not voted for a Republican presidential nominee since 1988 when the state was carried by George H. W. Bush over Michael Dukakis. As of the 2024 presidential election, this is the last election in which Litchfield County voted for the Democratic candidate, also making it the last time any presidential candidate has won every single county in the state.
To date, this is the last time that the city of Torrington and the towns of Barkhamsted, Colebrook, New Hartford, Preston, Scotland, Thompson, and Winchester voted Democratic.
Primaries
Campaign
Predictions
There were 16 news organizations who made state-by-state predictions of the election. Here are their last predictions before election day:
| Source | Ranking |
|---|---|
| D.C. Political Report | Likely D |
| Cook Political Report | Solid D |
| The Takeaway | Solid D |
| Electoral-vote.com | Solid D |
| Washington Post | Solid D |
| Politico | Solid D |
| RealClearPolitics | Solid D |
| FiveThirtyEight | Solid D |
| CQ Politics | Solid D |
| The New York Times | Solid D |
| CNN | Safe D |
| NPR | Solid D |
| MSNBC | Solid D |
| Fox News | Likely D |
| Associated Press | Likely D |
| Rasmussen Reports | Safe D |
Polling
Main article: Statewide opinion polling for the 2008 United States presidential election: ConnecticutBarack Obama won every single poll taken in the state, and every one of them by a double-digit margin of victory.
Fundraising
John McCain raised a total of $3,966,985. Barack Obama raised $9,727,617.
Advertising and visits
Obama spent $730,335 while McCain spent nothing on the state. Neither campaign visited the state.
Analysis
Connecticut is a part of New England, an area of the country that has in recent decades become a Democratic stronghold. The state went Republican in most of the elections from 1948 to 1988, the exceptions being the three in the 1960s. However, following Bill Clinton's narrow victory in the state in 1992, it has not been seriously contested by Republicans since. McCain ceded the state to Obama early on, despite the endorsement of the state's incumbent Senator Joe Lieberman, a Democrat-turned-Independent who still caucused with the Democrats but backed McCain for president in 2008.
In 2006, Democrats knocked off two incumbent Republicans and picked up two U.S. House seats in CT-02 and CT-05 (Joe Courtney and Chris Murphy, respectively). Although then-Governor M. Jodi Rell and Lieutenant Governor Michael Fedele were both moderate Republicans, all other statewide offices were held by Democrats. Democrats also enjoyed a supermajority status in both chambers of the Connecticut state legislature.
In 2008, Democrat Jim Himes defeated incumbent Republican Christopher Shays, who was at the time the only Republican member of the U.S. House from New England, for the U.S. House seat in Connecticut's 4th congressional district. This was largely because Obama carried the district with a staggering 60% of the vote—one of his best performances in a Republican-held district. Shays' defeat meant that for the first time in almost 150 years, there were no Republican Representatives from New England. In no other part of the country is a major political party completely shut out. At the state level, Democrats picked up 6 seats in the Connecticut House of Representatives and 1 seat in the Connecticut Senate.
Results
| 2008 United States presidential election in Connecticut | |||||
|---|---|---|---|---|---|
| Party | Candidate | Votes | Percentage | Electoral votes | |
| Democratic | Barack Obama | 997,773 | 60.59% | 7 | |
| Republican | John McCain | 629,428 | 38.22% | 0 | |
| Independent | Ralph Nader | 19,162 | 1.16% | 0 | |
| Constitution (Write-in) | Chuck Baldwin (Write-in) | 311 | 0.02% | 0 | |
| Green (Write-in) | Cynthia A. McKinney (Write-in) | 90 | 0.01% | 0 | |
| Socialist (Write-in) | Brian Moore (Write-in) | 19 | 0.00% | 0 | |
| Socialist Workers (Write-in) | Roger Calero (Write-in) | 10 | 0.00% | 0 | |
| Totals | 1,646,793 | 100.00% | 7 | ||
| Voter turnout (voting age population) | 62.1% | ||||
By county
| County | Barack Obama Democratic |
John McCain Republican |
Various candidates Other parties |
Margin | Total votes cast | ||||
|---|---|---|---|---|---|---|---|---|---|
| # | % | # | % | # | % | # | % | ||
| Fairfield | 242,936 | 58.72% | 167,736 | 40.54% | 3,059 | 0.74% | 75,200 | 18.18% | 413,741 |
| Hartford | 268,721 | 65.11% | 138,984 | 33.67% | 5,023 | 1.21% | 129,737 | 31.44% | 412,728 |
| Litchfield | 51,041 | 51.57% | 46,173 | 46.66% | 1,752 | 1.77% | 4,868 | 4.91% | 98,966 |
| Middlesex | 52,984 | 60.72% | 32,918 | 37.73% | 1,351 | 1.55% | 20,066 | 22.99% | 87,253 |
| New Haven | 233,589 | 61.01% | 144,650 | 37.78% | 4,647 | 1.22% | 88,939 | 23.23% | 382,886 |
| New London | 74,776 | 59.88% | 48,491 | 38.83% | 1,607 | 1.29% | 26,285 | 21.05% | 124,874 |
| Tolland | 45,043 | 59.67% | 29,266 | 38.76% | 1,182 | 1.57% | 15,777 | 20.91% | 75,501 |
| Windham | 28,673 | 56.39% | 21,210 | 41.72% | 961 | 1.89% | 7,463 | 14.67% | 50,844 |
| Totals | 997,773 | 60.59% | 629,428 | 38.22% | 19,592 | 1.19% | 368,345 | 22.37% | 1,646,793 |
- Counties that flipped from Republican to Democratic
- Litchfield (largest borough: Litchfield)
By congressional district
Barack Obama carried all 5 of Connecticut's congressional districts.
| District | McCain | Obama | Representative |
|---|---|---|---|
| 1st | 32.73% | 65.95% | John Larson |
| 2nd | 40.07% | 58.48% | Joe Courtney |
| 3rd | 36.28% | 62.50% | Rosa DeLauro |
| 4th | 39.64% | 59.70% | Chris Shays (110th Congress) |
| Jim Himes (111th Congress) | |||
| 5th | 42.40% | 56.34% | Chris Murphy |
Electors
Main article: List of 2008 United States presidential electorsTechnically the voters of Connecticut cast their ballots for electors: representatives to the Electoral College. Connecticut is allocated 7 electors because it has 5 congressional districts and 2 senators. All candidates who appear on the ballot or qualify to receive write-in votes must submit a list of 7 electors, who pledge to vote for their candidate and his or her running mate. Whoever wins the majority of votes in the state is awarded all sevenelectoral votes. Their chosen electors then vote for president and vice president. Although electors are pledged to their candidate and running mate, they are not obligated to vote for them. An elector who votes for someone other than his or her candidate is known as a faithless elector.
The electors of each state and the District of Columbia met on December 15, 2008, to cast their votes for president and vice president. The Electoral College itself never meets as one body. Instead the electors from each state and the District of Columbia met in their respective capitols.
The following were the members of the Electoral College from the state. All 7 were pledged to Barack Obama and Joe Biden:
- Shirley Steinmetz
- Nicholas Paindiris
- Andrea Jackson Brooks
- Jim Ezzes
- Lorraine McQueen
- Deborah McFadden
- Ken Delacruz
See also
References
- "D.C.'s Political Report: The complete source for campaign summaries". January 1, 2009. Archived from the original on January 1, 2009. Retrieved August 23, 2021.
- "Presidential". May 5, 2015. Archived from the original on May 5, 2015. Retrieved August 23, 2021.
- "Vote 2008 - The Takeaway - Track the Electoral College vote predictions". April 22, 2009. Archived from the original on April 22, 2009. Retrieved August 23, 2021.
- "Electoral-vote.com: President, Senate, House Updated Daily". electoral-vote.com. Retrieved August 23, 2021.
- ^ Based on Takeaway
- "POLITICO's 2008 Swing State Map - POLITICO.com". www.politico.com. Retrieved September 22, 2016.
- "RealClearPolitics - Electoral Map". Archived from the original on June 5, 2008.
- "CQ Presidential Election Maps, 2008". CQ Politics. Archived from the original on June 14, 2009. Retrieved December 20, 2009.
- Nagourney, Adam; Zeleny, Jeff; Carter, Shan (November 4, 2008). "The Electoral Map: Key States". The New York Times. Retrieved May 26, 2010.
- "October – 2008 – CNN Political Ticker - CNN.com Blogs". CNN. October 31, 2008. Archived from the original on June 19, 2010. Retrieved May 26, 2010.
- "Winning The Electoral College". Fox News. April 27, 2010.
- "roadto270". hosted.ap.org. Retrieved September 22, 2016.
- "Election 2008: Electoral College Update - Rasmussen Reports". www.rasmussenreports.com. Retrieved September 22, 2016.
- "Presidential Campaign Finance". Archived from the original on March 24, 2009. Retrieved August 3, 2009.
- "Map: Campaign Ad Spending - Election Center 2008 from CNN.com". CNN. Retrieved May 26, 2010.
- "Map: Campaign Candidate Visits - Election Center 2008 from CNN.com". CNN. Retrieved May 26, 2010.
- "Electoral College". California Secretary of State. Archived from the original on October 30, 2008. Retrieved November 1, 2008.
- U. S. Electoral College 2008 Election - Certificates
| (2007 ←) 2008 United States elections (→ 2009) | |
|---|---|
| U.S. President |
|
| U.S. Senate |
|
| U.S. House (election ratings) |
|
| Governors | |
| Attorneys General | |
| Other statewide elections |
|
| State legislatures |
|
| Mayors | |
| States |
|
| State and district results of the 2008 United States presidential election | ||
|---|---|---|
|  | |
| Elections in Connecticut | |
|---|---|
| General | |
| State Senate | |
| State House | |
| Governor |
|
| U.S. President |
|
| U.S. Senate |
|
| U.S. House |
|
| See also: Political party strength in Connecticut | |
| Elections in the United States | |
|---|---|
| |


