| Revision as of 06:38, 6 July 2006 editAl-Andalus (talk | contribs)Extended confirmed users, Pending changes reviewers14,529 editsmNo edit summary← Previous edit | Revision as of 06:40, 6 July 2006 edit undoCieloEstrellado (talk | contribs)18,784 edits →Ethnic groupsNext edit → | ||
| Line 87: | Line 87: | ||
| ===Ethnic groups=== | ===Ethnic groups=== | ||
| :white and white-Amerindian 95%, Amerindian 3%, other 2% |
:white and white-Amerindian 95%, Amerindian 3%, other 2% | ||
| ===Religions=== | ===Religions=== | ||
Revision as of 06:40, 6 July 2006
| Those belonging to recognised indigenous communities (2002) | |||||
|---|---|---|---|---|---|
| Alacalufe | 2.622 | 0,02% | Mapuche | 604.349 | 4,00% |
| Atacameño | 21.015 | 0,14% | Quechua | 6.175 | 0,04% |
| Aymara | 48.501 | 0,32% | Rapanui | 4.647 | 0,03% |
| Colla | 3.198 | 0,02% | Yámana | 1.685 | 0,01% |

Chile is a relatively homogenous country and most of its population is of predominantly Spanish origin with varying degrees of native Amerindian admixture.
Background
The mestizo composition of Chileans is marked by a socio-genetic gradient where Amerindian admixture typically correlates to social levels. Amerindian contribution tends to be strongest in the lower echelons of society, with the middle class majority presenting a more balanced degree of both European and Amerindian ancestry, while those in the upper class tend to register the lowest degree of Amerindian contribution.
According to the Program of Human Genetics of the University of Chile, the generalized racial contribution of Chile's population, calculated by the use of nuclear markers, is approximately 60% European contribution and 40% Amerindian, depending on the socioeconomic level. According to Rothhammer (1987/2004), this generalized racial contribution stands at 57% European contribution and 43% Amerindian .
According to the 2005 Chilean census, a total of 3% of the total population declared themselves indigenous. At the 2002 census, only indigenous people that still practiced or spoke a native culture and language were surveyed: 4.6% of the population (692,192 people) fit that description; of these, 87.3% declared themselves Mapuche. .
Small numbers of non-Spanish European immigrants arrived in Chile - mainly to the northern and southern extremities of the country - during the XIX and XX centuries, including English, Irish, Italians, French, and Balkans. In 1848 a small but noteworthy German immigration took place, sponsored by the Chilean government with aims of colonising the southern region. With time, and although undertaken by no more than 7,000 people, that German immigration influenced in a certain way the cultural composition of the southern provinces of Valdivia, Llanquihue and Osorno. Although the total number of these European immigrants was relatively small, and they did not achieve much more than to add a non-Spanish element to the upper classes, their presence did transform the country technologically, economically, religiously, and culturally. To these immigrations it is also worth mentioning the Korean and especially Palestinian communities, the latter being the largest colony of that people outside of the Arab world.
The volume of immigrants from neighbouring countries to Chile during these same periods has been of a similar value. Currently, immigration from neighboring countries to Chile is greatest, and during the last decade immigration to Chile has doubled to 184,464 people in 2002, originating primarily from Argentina, Bolivia and Peru.
During the last decade immigration to Chile has doubled to 184,464 people in 2002, originating primarily from the neighbouring countries of Argentina, Bolivia and Peru. On the other hand, although emigration of Chileans has decreased during the last decade, it is estimated that 857,781 Chileans live abroad, 50.1% of those being in Argentina, 13.3% in the United States and a 4.9% in Sweden. Interregional population mobility within Chile has also increased in the last decades causing a massive migration from the rural areas towards the larger cities. While in the south-central regions of the country more than 80% of the population was local born (in the Region of Biobío levels reach 86.11%), in the Metropolitan Region of Santiago only 71% of the population was local born, while in the more extreme regions such as the Region of Magallanes this number reaches only 55%.
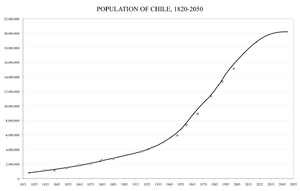
About 85% of Chile's population lives in urban areas, with 40% living in Greater Santiago. Chile's population growth is among the lowest in Latin America, at around 0.97%, it comes third only to Uruguay and Cuba.
Demographic data
Population
- 16,134,219 (April 2006 est.)
Age structure
- 0-14 years: 24.7% (male 2,035,278/female 1,944,754)
- 15-64 years: 67.1% (male 5,403,525/female 5,420,497)
- 65 years and over: 8.2% (male 555,075/female 775,090) (2006 est.)
Median age
- Total: 30.4 years
- Male: 29.5 years
- Female: 31.4 years (2006 est.)
Population growth rate
- 0.94% (2006 est.)
Birth rate
- 15.23 births/1,000 population (2006 est.)
Death rate
- 5.81 deaths/1,000 population (2006 est.)
Net migration rate
- 0 migrant(s)/1,000 population (2006 est.)
Sex ratio
- At birth: 1.05 male(s)/female
- Under 15 years: 1.05 male(s)/female
- 15-64 years: 1 male(s)/female
- 65 years and over: 0.72 male(s)/female
- Total population: 0.98 male(s)/female (2006 est.)
Infant mortality rate
- Total: 8.58 deaths/1,000 live births
- Male: 9.32 deaths/1,000 live births
- Female: 7.8 deaths/1,000 live births (2006 est.)
Life expectancy at birth
- Total population: 76.77 years
- Male: 73.49 years
- Female: 80.21 years (2006 est.)
Total fertility rate
- 2 children born/woman (2006 est.)
HIV/AIDS
- Adult prevalence rate: 0.3% (2003 est.)
- People living with HIV/AIDS: 26,000 (2003 est.)
- Deaths: 1,400 (2003 est.)
Nationality
- Noun: Chilean(s)
- Adjective: Chilean
Ethnic groups
Religions
- Roman Catholic 89%, Protestant 11%, Jewish NEGL%
Languages
- Spanish
Literacy
- Definition: age 15 and over can read and write
- Total population: 96.2%
- Male: 96.4%
- Female: 96.1% (2003 est.)
References
| Demographics of South America | |
|---|---|
| Sovereign states | |
| Dependencies and other territories | |