This is an old revision of this page, as edited by Salix alba (talk | contribs) at 02:34, 1 February 2006 (→See also: rm repeated links). The present address (URL) is a permanent link to this revision, which may differ significantly from the current revision.
Revision as of 02:34, 1 February 2006 by Salix alba (talk | contribs) (→See also: rm repeated links)(diff) ← Previous revision | Latest revision (diff) | Newer revision → (diff)Venn diagrams are illustrations used in the branch of mathematics known as set theory. They are used to show the mathematical or logical relationship between different groups of things (sets).
A Venn diagram shows all the logical relations between the sets. Euler diagrams are similar, but do not need to show all the relations.
Examples

The orange circle (set A) might represent, for example, all living creatures which are two-legged. The blue circle, (set B) might represent all living creatures which can fly. The area where the blue and orange circles overlap (which is called the intersection) contains all living creatures which both can fly and which have two legs - for example, parrots. (Imagine each separate type of creature as a point somewhere in the diagram).
Humans and penguins would be in the orange circle, in the part which does not overlap with the blue circle. Mosquitos have six legs, and fly, so the point for mosquitos would be in the part of the blue circle which does not overlap with the orange one. Things which do not have two legs and cannot fly (for example, whales and rattlesnakes) would all be represented by points outside both circles. Technically, the Venn diagram above can be interpreted as "the relationships of set A and set B which may have some (but not all) elements in common".
The combined area of sets A and B is called the union of sets A and B. The union in this case contains all things which either have two legs, or which fly, or both. That the circles overlap implies that the union of the two sets is not empty - that, in fact, there are creatures that are in both the orange and blue circles.
Sometimes a rectangle, (called the Universe) is drawn around the Venn diagram to show the space of all possible things. As mentioned above, a whale would be represented by a point that is not in the union, but is in the Universe (of living creatures, or of all things, depending on how one chose to define the Universe for a particular diagram).
Similar diagrams
Euler diagrams

Euler diagrams are similar to Venn Diagrams, but do not need all the possible relations. In the diagram on the right, one set is entirely inside another one. Let's say that set A is all the different types of cheeses that can be found in the world, and set B is all the foodstuffs that can be found in the world. From the diagram, you can see that all cheeses are foodstuffs, but not all foodstuffs are cheeses. Further, set C (let's say, things made of metal) has no elements (members of the set) in common with set B, and from this we can logically assert that no cheeses are metal things (and vice versa). The diagram can be interpreted as:
- set A is a proper subset of set B, but set C has no elements in common with set B.
Or, as a syllogism
- All As are Bs
- No Cs are Bs
- Therefore No Cs are As.
- Therefore No As are Cs.
Johnston diagram
Johnston diagrams are used to illustrate statements in propositional logic such as A and not B and are a visual way of illustrating truth tables. They can be identical in appearance to Venn diagrams, but do not represent sets of object.
Peirce diagrams
Peirce diagrams, devised by Charles Peirce, are extensions to Venn diagrams which include information on existential statements, disjunctive information, probabilities, and relations. .
Extensions to higher numbers of sets
Venn was keen to find ‘symmetrical figures…elegant in themselves’ and he devised a four set diagram using ellipses.
Edward-Venn diagrams
 |
 |
 |
 |
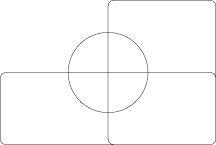
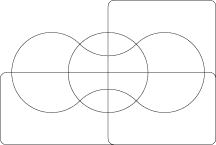
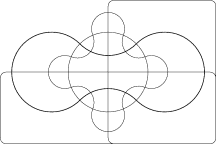
Venn diagrams typically have three sets. A. W. F. Edwards generalised the concept to higher numbers of sets. This was achieved by projecting the Venn diagram onto a sphere. Three sets can be easily represented by taking three hemispheres at right angles (x≥0, y≥0 and z≥0). A fourth sets can be represented by taking curves similar to the seam on a tennis ball which winds up and down around the equator. The resulting sets can then be projected back to the plane to give cogwheel diagrams with increasing numbers of teeth. These diagrams were devised while designing a stained-glass window in memoriam to Venn.
Other diagrams
Edward-Venn diagrams are topologically equivalent to diagrams devised by Branko Grünbaum which were based around intersecting polygons with increasing numbers of sides. They are also 2-dimensional representations of hypercubes.
Smith devised similar n-set diagrams using sine curves with equations y=sin(2x)/2, 0≤i≤n-2.
Samuel Dodgson (a.k.a. Lewis Carrol) devised a five set diagram.
Origins
John Venn was a 19th-century British philosopher and mathematician who introduced the Venn diagram in 1881.
A stained glass window in Caius College, Cambridge, commemorates his invention.
References
- I. Stewart Another Fine Math You've Got Me Into 1992 ch4
- A.W.F. Edwards. Cogwheels of the Mind: the story of Venn diagrams, Johns Hopkins University Press, Baltimore and London, 2004.
- Review of Cogwheels of the Mind
See also
External links
- What is a Venn diagram?
- LogicTutorial.com - interactive Johnston diagram
- Lewis Carroll's Logic Game — Venn vs. Euler at cut-the-knot
- A Survey of Venn Diagrams
- Venn Diagrams at cut-the-knot
- Region Identification in Venn Diagrams at cut-the-knot