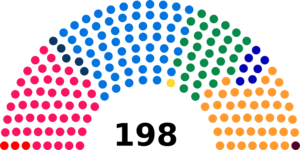
Federal elections were held in Switzerland on 25 October 1925. The Free Democratic Party remained the largest party in the National Council, winning 60 of the 198 seats.
Results
National Council
 | |||||
|---|---|---|---|---|---|
| Party | Votes | % | Seats | +/– | |
| Free Democratic Party | 206,485 | 27.77 | 60 | 0 | |
| Social Democratic Party | 192,208 | 25.85 | 49 | +6 | |
| Conservative People's Party | 155,467 | 20.91 | 42 | –2 | |
| Party of Farmers, Traders and Independents | 113,512 | 15.26 | 30 | –4 | |
| Liberal Democratic Party | 22,217 | 2.99 | 7 | –3 | |
| Democratic Group | 16,362 | 2.20 | 5 | +2 | |
| Communist Party | 14,837 | 2.00 | 3 | +1 | |
| Evangelical People's Party | 6,888 | 0.93 | 1 | 0 | |
| Liberal Socialist Party | 1,602 | 0.22 | 0 | 0 | |
| Grütli Union | 427 | 0.06 | 0 | 0 | |
| Union for Economic Defence | 13,674 | 1.84 | 1 | New | |
| Other parties | 0 | – | |||
| Total | 743,679 | 100.00 | 198 | 0 | |
| Valid votes | 743,679 | 97.26 | |||
| Invalid/blank votes | 20,915 | 2.74 | |||
| Total votes | 764,594 | 100.00 | |||
| Registered voters/turnout | 995,551 | 76.80 | |||
| Source: Nohlen & Stöver | |||||
By constituencies
Council of States
In several cantons the members of the Council of States were chosen by the cantonal parliaments.
 | |||
|---|---|---|---|
| Party | Seats | +/– | |
| Free Democratic Party | 21 | –2 | |
| Swiss Conservative People's Party | 18 | +1 | |
| Social Democratic Party | 2 | +1 | |
| Democratic Group | 1 | 0 | |
| Liberal Democratic Party | 1 | 0 | |
| Party of Farmers, Traders and Independents | 1 | 0 | |
| Other parties | 0 | 0 | |
| Total | 44 | 0 | |
| Source: Nohlen & Stöver | |||
By canton
References
- Nohlen, D & Stöver, P (2010) Elections in Europe: A data handbook, p1894 ISBN 9783832956097
- Nohlen & Stöver, p1953
- Nohlen & Stöver, p1956
