Local election in Cheshire, England
1959 Sale Municipal Borough Council election Sale Municipal Borough Council
First party
Second party
Third party
Party
Conservative
Labour
Liberal
Last election
4 seats,
3 seats,
1 seats,
Seats before
21
5
4
Seats won
6
2
0
Seats after
22
7
3
Seat change
Popular vote
8,560
3,469
3,013
Percentage
56.7%
23.1%
20.0%
Swing
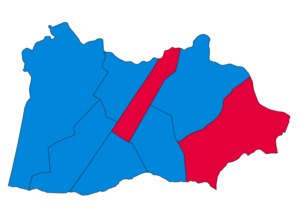
Elections to Sale Council were held on Thursday, 7 May 1959. One third of the councillors were up for election, with each successful candidate to serve a three-year term of office. The Conservative Party retained overall control of the council.
Election result
Party
Votes
Seats
Full Council
Conservative Party
8,560 (56.9%)
6 (75.0%)
6 / 8
22 (68.8%)
22 / 32
Labour Party
3,469 (23.1%)
2 (25.0%)
2 / 8
7 (21.9%)
7 / 32
Liberal Party
3,013 (20.0%)
0 (0.0%)
0 / 8
3 (9.4%)
3 / 32
Full council
Aldermen
Councillors
Ward results
Brooklands
Mersey
St. Anne's
St. John's
St. Martin's
St. Mary's
St. Paul's
Sale Moor
Sale Moor
Party
Candidate
Votes
%
±%
Labour
W. M. Phillips*
uncontested
Labour hold
Swing
References
Town by town poll results , Manchester Evening News, May 8, 1959, p.5
Lancashire and Cheshire Boroughs , The Manchester Guardian, May 8, 1959, p.4
Categories :
Text is available under the Creative Commons Attribution-ShareAlike License. Additional terms may apply.
**DISCLAIMER** We are not affiliated with Wikipedia, and Cloudflare.
The information presented on this site is for general informational purposes only and does not constitute medical advice.
You should always have a personal consultation with a healthcare professional before making changes to your diet, medication, or exercise routine.
AI helps with the correspondence in our chat.
We participate in an affiliate program. If you buy something through a link, we may earn a commission 💕
↑
 Map of results of 1959 election