| |||||||||||||||||||||||||||||||||||||||||||||||||||||||||||||||||||||||||||
All 79 seats of Cornwall County Council 40 seats needed for a majority | |||||||||||||||||||||||||||||||||||||||||||||||||||||||||||||||||||||||||||
|---|---|---|---|---|---|---|---|---|---|---|---|---|---|---|---|---|---|---|---|---|---|---|---|---|---|---|---|---|---|---|---|---|---|---|---|---|---|---|---|---|---|---|---|---|---|---|---|---|---|---|---|---|---|---|---|---|---|---|---|---|---|---|---|---|---|---|---|---|---|---|---|---|---|---|---|
| |||||||||||||||||||||||||||||||||||||||||||||||||||||||||||||||||||||||||||
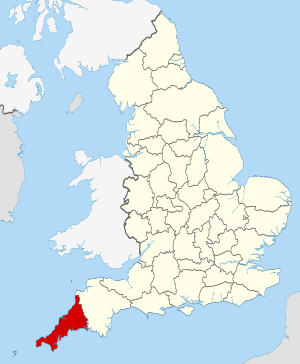
 The County of Cornwall within England The County of Cornwall within England | |||||||||||||||||||||||||||||||||||||||||||||||||||||||||||||||||||||||||||
| |||||||||||||||||||||||||||||||||||||||||||||||||||||||||||||||||||||||||||
The 2001 Cornwall County Council election, was an election for all 79 seats on the council. Cornwall County Council was a county council that covered the majority of the ceremonial county of Cornwall, with the exception of the Isles of Scilly which had an independent local authority. The elections took place concurrently with other local elections across England and Northern Ireland. The council remained under no overall control, with the Liberal Democrats as the largest party.
Election result
| Party | Seats | Gains | Losses | Net gain/loss | Seats % | Votes % | Votes | +/− | |
|---|---|---|---|---|---|---|---|---|---|
| Liberal Democrats | 35 | 44.3 | 36.3 | 87,700 | |||||
| Independent | 25 | 31.6 | 23.3 | 56,410 | |||||
| Conservative | 9 | 11.4 | 25.2 | 61,026 | |||||
| Labour | 9 | 11.4 | 10.9 | 26,368 | |||||
| Liberal | 1 | 1.3 | 0.8 | 1,932 | |||||
| Mebyon Kernow | 0 | 0.0 | 3.5 | 8,405 | |||||
References
- "Local Election Summaries 2001". The Elections Centre. Retrieved 1 July 2019.
- "Cornwall County Council Election Results 1973-2005" (PDF). Elections Centre.
- "Vote 2001:Local Elections". BBC News.
- Local Election Results 2005: Cornwall p.2