| |||||||||||||||||||||||||||||||||||||
All 29 seats in the Corby Borough Council 15 seats needed for a majority | |||||||||||||||||||||||||||||||||||||
---|---|---|---|---|---|---|---|---|---|---|---|---|---|---|---|---|---|---|---|---|---|---|---|---|---|---|---|---|---|---|---|---|---|---|---|---|---|
| |||||||||||||||||||||||||||||||||||||
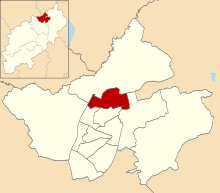
Map showing the results of the 2003 Corby Borough Council elections. | |||||||||||||||||||||||||||||||||||||
|
The 2003 Corby Borough Council election took place on 1 May 2003 to elect members of Corby Borough Council in Northamptonshire, England. The Labour Party retained overall control of the council, which it had held continuously since 1979.
Results summary
The overall results, using average ward votes for the total number of votes cast, were as follows:
Corby Borough Council Elections 2003: Summary Results | |||||||
---|---|---|---|---|---|---|---|
Party | Candidates | Votes | % Votes | Seats | % Seats | Change | |
Labour | 29 | 7,118 | 40.3 | 18 | 62.1 | -9 | |
Conservative | 18 | 6,397 | 36.2 | 9 | 31.0 | +8 | |
Liberal Democrats | 10 | 3,189 | 18.0 | 2 | +1 | ||
Independent | 3 | 967 | 5.5 | 0 | 6.9 | 0 | |
Total | 60 | 16,740 | 29 | ||||
Electorate | |||||||
Turnout |
(Vote counts shown are ward averages)
Ward-by-Ward Results
Central Ward (3 seats)
Party | Candidate | Votes | % | |
---|---|---|---|---|
Labour | James Noble | 661 | 21.9 | |
Conservative | Michael Rodden | 639 | 21.9 | |
Labour | John O'Neill | 595 | 20.4 | |
Labour | Robert Hearne | 579 | 19.8 | |
Liberal Democrats | Colin Barratt | 444 | 15.2 |
Ward Summary | |||||
---|---|---|---|---|---|
Party | Votes | % Votes | Seats | Change | |
Conservative | 639 | 37.7 | 1 | +1 | |
Labour | 612 | 36.1 | 2 | -1 | |
Liberal Democrats | 444 | 26.2 | 0 | 0 | |
Total Votes Cast | 1,695 | ||||
Electorate | |||||
Turnout |
(Vote count shown is ward average)
Danesholme Ward (3 seats)
Party | Candidate | Votes | % | |
---|---|---|---|---|
Conservative | Raymond Jackson | 720 | 14.4 | |
Conservative | Raymond Boyd | 690 | 13.8 | |
Liberal Democrats | Chris Stanbra | 687 | 13.8 | |
Labour | Alexis Hill | 638 | 12.8 | |
Liberal Democrats | Christopher Shelley | 623 | 12.5 | |
Labour | Keith Hudson | 619 | 12.4 | |
Labour | Joseph Spooner | 534 | 10.7 | |
Liberal Democrats | Richard Jones | 478 | 9.6 |
Ward Summary | |||||
---|---|---|---|---|---|
Party | Votes | % Votes | Seats | Change | |
Conservative | 705 | 37.1 | 2 | +2 | |
Labour | 597 | 31.5 | 0 | -3 | |
Liberal Democrats | 596 | 31.4 | 1 | +1 | |
Total Votes Cast | 1,898 | ||||
Electorate | |||||
Turnout |
(Vote count shown is ward average)
East Ward (2 seats)
Party | Candidate | Votes | % | |
---|---|---|---|---|
Labour | Mark Pengelly | 669 | 40.2 | |
Labour | Betty Wade | 464 | 27.9 | |
Conservative | Brian Cummings | 302 | 18.2 | |
Conservative | Bernard Howard | 228 | 13.7 |
Ward Summary | |||||
---|---|---|---|---|---|
Party | Votes | % Votes | Seats | Change | |
Labour | 567 | 68.1 | 2 | 0 | |
Conservative | 265 | 31.9 | 0 | 0 | |
Total Votes Cast | 832 | ||||
Electorate | |||||
Turnout |
(Vote count shown is ward average)
Hazlewood Ward (3 seats)
Party | Candidate | Votes | % | |
---|---|---|---|---|
Labour | Peter McEwan | 810 | 21.7 | |
Labour | Ann Ferns | 785 | 21.0 | |
Labour | Robert Scott | 748 | 20.1 | |
Conservative | Robert Tustin | 477 | 12.8 | |
Conservative | Clive Reed | 470 | 12.6 | |
Liberal Democrats | Karen Parker | 440 | 11.8 |
Ward Summary | |||||
---|---|---|---|---|---|
Party | Votes | % Votes | Seats | Change | |
Labour | 781 | 46.1 | 3 | 0 | |
Conservative | 474 | 27.9 | 0 | 0 | |
Liberal Democrats | 440 | 26.0 | 0 | 0 | |
Total Votes Cast | 1,695 | ||||
Electorate | |||||
Turnout |
(Vote count shown is ward average)
Hillside Ward (1 seat)
Party | Candidate | Votes | % | |
---|---|---|---|---|
Labour | Edwin Gordon | 229 | 37.4 | |
Liberal Democrats | Dominic Maguire | 213 | 34.7 | |
Conservative | William Owen | 171 | 27.9 |
Ward Summary | |||||
---|---|---|---|---|---|
Party | Votes | % Votes | Seats | Change | |
Labour | 229 | 37.4 | 1 | 0 | |
Liberal Democrats | 213 | 34.7 | 0 | 0 | |
Conservative | 171 | 27.9 | 0 | 0 | |
Total Votes Cast | 613 | ||||
Electorate | |||||
Turnout |
(Vote count shown is ward average)
Kingswood Ward (3 seats)
Party | Candidate | Votes | % | |
---|---|---|---|---|
Labour | Maureen Forshaw | 719 | 20.9 | |
Labour | Willie Smith | 650 | 18.9 | |
Labour | Bryan Massie | 644 | 18.8 | |
Conservative | Yvonne Von Bujtar | 562 | 16.4 | |
Conservative | Suman Sood | 441 | 12.8 | |
Liberal Democrats | Christopher Latham | 416 | 12.1 |
Ward Summary | |||||
---|---|---|---|---|---|
Party | Votes | % Votes | Seats | Change | |
Labour | 671 | 42.2 | 3 | 0 | |
Conservative | 502 | 31.6 | 0 | 0 | |
Liberal Democrats | 416 | 26.2 | 0 | 0 | |
Total Votes Cast | 743 | ||||
Electorate | 2,534 | ||||
Turnout | 29.3% |
(Vote count shown is ward average)
Lloyds Ward (3 seats)
Party | Candidate | Votes | % | |
---|---|---|---|---|
Labour | Jimmy Kane | 1,133 | 24.9 | |
Labour | Patricia Fawcett | 961 | 21.1 | |
Conservative | Sally Jones | 843 | 18.5 | |
Conservative | Stanley Fleming | 838 | 18.4 | |
Labour | Samuel Hagen | 773 | 17.0 |
Ward Summary | |||||
---|---|---|---|---|---|
Party | Votes | % Votes | Seats | Change | |
Labour | 956 | 53.2 | 2 | -1 | |
Conservative | 841 | 46.8 | 1 | +1 | |
Total Votes Cast | 1,796 | ||||
Electorate | |||||
Turnout |
(Vote count shown is ward average)
Lodge Park (3 seats)
Party | Candidate | Votes | % | |
---|---|---|---|---|
Conservative | Christopher Woolmer | 892 | 25.7 | |
Labour | Jean Addison | 708 | 20.4 | |
Labour | David Harley | 652 | 18.8 | |
Labour | Mark Hill | 634 | 18.3 | |
Liberal Democrats | Julie Connachie | 581 | 16.8 |
Ward Summary | |||||
---|---|---|---|---|---|
Party | Votes | % Votes | Seats | Change | |
Conservative | 892 | 41.7 | 1 | +1 | |
Labour | 665 | 31.1 | 2 | -1 | |
Liberal Democrats | 581 | 27.2 | 0 | 0 | |
Total Votes Cast | 2,138 | ||||
Electorate | |||||
Turnout |
(Vote count shown is ward average)
Rural East Ward (2 seats)
Party | Candidate | Votes | % | |
---|---|---|---|---|
Conservative | Stanley Heggs | 761 | 37.9 | |
Conservative | Andrew Howard | 588 | 29.3 | |
Labour | John Kane | 260 | 13.0 | |
Independent | George Reed | 232 | 11.6 | |
Labour | Ashok Nathwani | 166 | 8.3 |
Ward Summary | |||||
---|---|---|---|---|---|
Party | Votes | % Votes | Seats | Change | |
Conservative | 675 | 60.3 | 2 | +1 | |
Independent | 232 | 20.7 | 0 | 0 | |
Labour | 213 | 19.0 | 0 | -1 | |
Total Votes Cast | 1,120 | ||||
Electorate | |||||
Turnout |
(Vote count shown is ward average)
Rural North Ward (1 seats)
Party | Candidate | Votes | % | |
---|---|---|---|---|
Liberal Democrats | Philip Bromhall | 265 | 42.3 | |
Conservative | Paul Seaton | 250 | 39.9 | |
Labour | John Anderson | 111 | 17.7 |
Ward Summary | |||||
---|---|---|---|---|---|
Party | Votes | % Votes | Seats | Change | |
Liberal Democrats | 265 | 42.3 | 1 | +1 | |
Conservative | 250 | 39.9 | 0 | 0 | |
Labour | 111 | 17.7 | 0 | -1 | |
Total Votes Cast | 626 | ||||
Electorate | |||||
Turnout |
(Vote count shown is ward average)
Rural West Ward (1 seat)
Party | Candidate | Votes | % | |
---|---|---|---|---|
Conservative | Bob Rutt | 338 | 54.8 | |
Liberal Democrats | Sidney Beecroft | 143 | 23.2 | |
Labour | Gary McNeil | 136 | 22.0 |
Ward Summary | |||||
---|---|---|---|---|---|
Party | Votes | % Votes | Seats | Change | |
Conservative | 338 | 54.8 | 1 | +1 | |
Liberal Democrats | 143 | 23.2 | 0 | -1 | |
Labour | 136 | 22.0 | 0 | 0 | |
Total Votes Cast | 617 | ||||
Electorate | |||||
Turnout |
(Vote count shown is ward average)
(Background: Bob Rutt defected from the Liberal Democrats after the 1999 Borough Council elections)
Shire Lodge (2 seats)
Party | Candidate | Votes | % | |
---|---|---|---|---|
Labour | Raymond Beeby | 544 | 31.8 | |
Conservative | Alexander Torrie | 442 | 25.9 | |
Labour | Graham Bold | 412 | 24.1 | |
Independent | John Wood-Cowling | 311 | 18.2 |
Ward Summary | |||||
---|---|---|---|---|---|
Party | Votes | % Votes | Seats | Change | |
Labour | 478 | 38.8 | 1 | -1 | |
Conservative | 442 | 35.9 | 1 | +1 | |
Independent | 311 | 25.3 | 0 | 0 | |
Total Votes Cast | 1,231 | ||||
Electorate | |||||
Turnout |
(Vote count shown is ward average)
West Ward (2 seats)
Party | Candidate | Votes | % | |
---|---|---|---|---|
Labour | William Latta | 500 | 36.7 | |
Labour | Thomas Beattie | 437 | 32.1 | |
Independent | Raymond Telfer | 424 | 31.2 |
Ward Summary | |||||
---|---|---|---|---|---|
Party | Votes | % Votes | Seats | Change | |
Labour | 469 | 52.5 | 2 | 0 | |
Independent | 424 | 47.5 | 0 | 0 | |
Total Votes Cast | 893 | ||||
Electorate | |||||
Turnout |
(Vote count shown is ward average)
See also
References
- "Local Election Summaries 2003". The Elections Centre. Retrieved 28 June 2019.
- ^ "Corby Borough Council". Political Science Resources. Archived from the original on 8 October 2011. Retrieved 14 August 2009.