Main article: 2012 United States presidential election
| ||||||||||||||||||||||||||
| Turnout | 72% | |||||||||||||||||||||||||
|---|---|---|---|---|---|---|---|---|---|---|---|---|---|---|---|---|---|---|---|---|---|---|---|---|---|---|
| ||||||||||||||||||||||||||
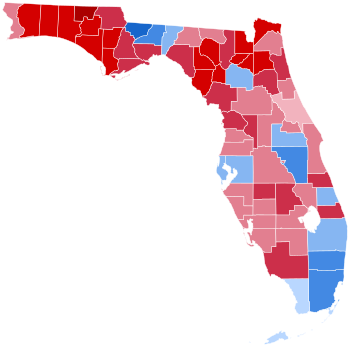 County results County results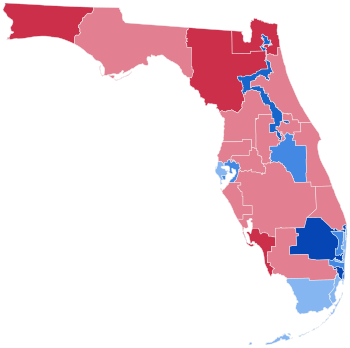 Congressional district results Congressional district results
| ||||||||||||||||||||||||||
| ||||||||||||||||||||||||||
The 2012 United States presidential election in Florida took place on November 6, as part of the 2012 U.S. presidential election in which all 50 states plus the District of Columbia participated. Florida voters chose 29 electors to represent them in the Electoral College via a popular vote pitting incumbent Democratic President Barack Obama and his running mate, Vice President Joe Biden, against Republican challenger and former Massachusetts Governor Mitt Romney and his running mate, U.S. Representative Paul Ryan.
By November 8, the vote counting had still not concluded. However, with much of the remaining vote still coming in was from heavily Democratic areas, Romney's Florida campaign acknowledged that he had lost the state to Obama. In order to certify the election in Florida, the ballots continued to be counted. Both Miami-Dade and Broward County completed their ballot counts on November 8, leaving Palm Beach and Duval counties as the only two that did not have a final count at the end of the day.
Florida required all counties to finish counting by noon Saturday but would not announce an official winner until the votes were certified on November 20. A recount is not done unless the difference is less than 0.5%. At 11 PM EST on November 9, the margin for Obama was 0.86%, with all but one county finished with their counting. On November 10, most major news sources projected Obama to be the winner of Florida's 29 electoral votes. It was the last state to be called in the 2012 presidential election and also the closest.
Despite Tampa having been the site of the 2012 Republican National Convention, Obama ultimately carried Florida with 50.01% of the vote, to Romney's 49.13%, a margin of 0.88%. Having also won the state in 2008, Obama's 2012 victory made him the first Democratic president since Franklin D. Roosevelt in 1944 to carry Florida twice, and also marked the first time since 1948 that the state voted Democratic in consecutive elections. Nonetheless, Obama's margin of victory decreased from 2.81% in 2008, and his percentage of the vote decreased from 50.91%. He also lost Flagler and Volusia Counties, which he had won in 2008; he thus became the first Democrat to win the White House without carrying the former since Harry S. Truman in 1948 and the first to do so without carrying the latter since John F. Kennedy in 1960.
As of the 2024 presidential election, this is the last time that a Democratic presidential nominee has carried Florida, or the following counties: Jefferson, St. Lucie, and Monroe. This also remains the second closest presidential result in the state ever, behind only the infamous 2000 election.
Primary elections
Democratic primary
| This section is empty. You can help by adding to it. (June 2022) |
Republican primary
| |||||||||||||||||||||||||||||||||||||||||
| |||||||||||||||||||||||||||||||||||||||||
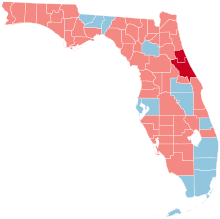
 Florida results by county
Mitt Romney
Newt Gingrich Florida results by county
Mitt Romney
Newt Gingrich | |||||||||||||||||||||||||||||||||||||||||
The Republican primary was held on January 31, 2012. Fifty delegates were at stake, none of them RNC (or super) delegates; it is unclear whether these delegates will be allocated proportionally or winner-take-all. Originally awarded 99 delegates, the Republican National Committee removed half of Florida's delegates because the state committee moved its Republican primary before March 6; the Republican National Committee rules also set the delegate allocation to be proportional because the contest was held before April 1. It is a closed primary. There were 4,063,853 registered Republican voters as of January 3, 2012.
Florida is spread over two time zones, so voting wasn't completed until 7 pm CST/8pm EST.
Significance
In an effort to increase the political importance of their state's primary and receive added media exposure often directed to the early contests, Florida decided to plan its primary ahead of the early contests, a move that violated Republican Party rules and forced early states to move up their contests. Florida announced that their primary would occur on January 31 instead of the expected March; Iowa, New Hampshire and South Carolina were expected to have their primaries in February but were forced to push their primaries into January, thereby shortening the overall amount of time that each person could campaign. Florida made this move in 2008.
As a result of this calendar violation, Florida was stripped of half of its delegates, awarding only 50 delegates instead of the original 100 delegates.
Dean Cannon, the Republican speaker of the Florida House of Representatives: "My goal all along is for Florida to preserve her place as the fifth spot on the nominating calendar and not to move ahead of Iowa and New Hampshire."
Controversy
According to a Gingrich campaign memo, he planned to challenge the results based on an interpretation of the Republican National Committee's rules that state that no contest can be winner-take-all prior to April 1, 2012. Gingrich would have requested that delegates be divided proportionally, corresponding to the percentage of votes each candidate received. It is not known what result a successful challenge might have had.
General election
Predictions
| Source | Ranking | As of |
|---|---|---|
| Huffington Post | Tossup | November 6, 2012 |
| CNN | Tossup | November 6, 2012 |
| New York Times | Tossup | November 6, 2012 |
| Washington Post | Tossup | November 6, 2012 |
| RealClearPolitics | Tossup | November 6, 2012 |
| Sabato's Crystal Ball | Lean R (flip) | November 5, 2012 |
| FiveThirtyEight | Lean D | November 6, 2012 |
Results

| Obama 40-50% 50-60% 60-70% 70-80% 80-90% | Romney 50-60% 60-70% 70-80% |
The final vote count was unknown at noon Friday, November 9, 2012. The delay in the final count was caused by a combination of an extremely long ballot (with eleven state amendment questions) and a high number of absentee ballots. There were 240,000 absentee ballots in Miami -Dade County alone, with 54,000 of these cast on election day. Four urban counties, Dade, Broward, Palm Beach and Duval, all experienced problems with counting their large number of absentee ballots. Each ballot had to be hand certified page by page, and then the pages had to be hand fed into the counting machine one by one. At noon Friday, Dade and Broward had finished counting, but Palm Beach and Duval were still counting.
| 2012 United States presidential election in Florida | ||||||
|---|---|---|---|---|---|---|
| Party | Candidate | Votes | Percentage | Electoral votes | ||
| Democratic | Barack Obama (incumbent) | 4,237,756 | 50.01% | 29 | ||
| Republican | Mitt Romney | 4,163,447 | 49.13% | 0 | ||
| Libertarian | Gary Johnson | 44,726 | 0.53% | 0 | ||
| Green | Jill Stein | 8,947 | 0.11% | 0 | ||
| Peace and Freedom Party | Roseanne Barr | 8,154 | 0.10% | 0 | ||
| Objectivist Party | Tom Stevens | 3,856 | 0.05% | 0 | ||
| Justice Party | Rocky Anderson | 1,754 | 0.02% | 0 | ||
| America's Party | Tom Hoefling | 946 | 0.01% | 0 | ||
| Reform | Andre Barnett | 820 | 0.01% | 0 | ||
| Socialist | Stewart Alexander | 799 | 0.01% | 0 | ||
| Socialism and Liberation | Peta Lindsay | 322 | 0.01% | 0 | ||
| Totals | 8,474,179 | 100.00% | 29 | |||
| Voter turnout (eligible voters) | 72.00% | |||||
By county
| This section needs to be updated. The reason given is: The county table results do not match the election box or the infobox. please fix it.. Please help update this article to reflect recent events or newly available information. (June 2024) |
| County | Barack Obama Democratic |
Mitt Romney Republican |
Various candidates Other parties |
Margin | Total votes cast | ||||
|---|---|---|---|---|---|---|---|---|---|
| # | % | # | % | # | % | # | % | ||
| Alachua | 69,699 | 57.71% | 48,797 | 40.40% | 2,277 | 1.89% | 20,902 | 17.31% | 120,773 |
| Baker | 2,311 | 20.29% | 8,975 | 78.80% | 104 | 0.91% | -6,664 | -58.51% | 11,390 |
| Bay | 22,051 | 27.53% | 56,876 | 71.01% | 1,174 | 1.46% | -34,825 | -43.48% | 80,101 |
| Bradford | 3,325 | 28.51% | 8,219 | 70.46% | 120 | 1.03% | -4,894 | -41.95% | 11,664 |
| Brevard | 122,993 | 42.94% | 159,300 | 55.62% | 4,135 | 1.44% | -36,307 | -12.68% | 286,428 |
| Broward | 508,312 | 67.12% | 244,101 | 32.23% | 4,941 | 0.65% | 264,211 | 34.89% | 757,354 |
| Calhoun | 1,664 | 26.91% | 4,366 | 70.61% | 153 | 2.48% | -2,702 | -43.70% | 6,183 |
| Charlotte | 35,906 | 42.28% | 47,996 | 56.52% | 1,021 | 1.20% | -12,090 | -14.24% | 84,923 |
| Citrus | 28,460 | 38.37% | 44,662 | 60.22% | 1,047 | 1.41% | -16,202 | -21.85% | 74,169 |
| Clay | 25,759 | 26.61% | 70,022 | 72.33% | 1,024 | 1.06% | -44,263 | -45.72% | 96,805 |
| Collier | 51,698 | 34.62% | 96,520 | 64.64% | 1,106 | 0.74% | -44,822 | -30.02% | 149,324 |
| Columbia | 8,462 | 31.08% | 18,429 | 67.69% | 336 | 1.23% | -9,967 | -36.61% | 27,227 |
| DeSoto | 4,174 | 42.22% | 5,587 | 56.51% | 126 | 1.27% | -1,413 | -14.29% | 9,887 |
| Dixie | 1,798 | 25.84% | 5,052 | 72.60% | 109 | 1.56% | -3,254 | -46.76% | 6,959 |
| Duval | 196,737 | 47.67% | 211,615 | 51.27% | 4,381 | 1.06% | -14,878 | -3.60% | 412,733 |
| Escambia | 58,185 | 39.06% | 88,711 | 59.55% | 2,071 | 1.39% | -30,526 | -20.49% | 148,967 |
| Flagler | 23,207 | 45.77% | 26,969 | 53.19% | 531 | 1.04% | -3,762 | -7.42% | 50,707 |
| Franklin | 1,845 | 33.58% | 3,570 | 64.98% | 79 | 1.44% | -1,725 | -31.40% | 5,494 |
| Gadsden | 15,770 | 70.01% | 6,630 | 29.43% | 125 | 0.56% | 9,140 | 40.58% | 22,525 |
| Gilchrist | 1,885 | 23.75% | 5,917 | 74.55% | 135 | 1.70% | -4,032 | -50.80% | 7,937 |
| Glades | 1,603 | 40.03% | 2,344 | 58.54% | 57 | 1.43% | -741 | -18.51% | 4,004 |
| Gulf | 2,014 | 28.26% | 4,995 | 70.10% | 117 | 1.64% | -2,981 | -41.84% | 7,126 |
| Hamilton | 2,228 | 41.11% | 3,138 | 57.90% | 54 | 1.00% | -910 | -16.79% | 5,420 |
| Hardee | 2,463 | 34.00% | 4,696 | 64.83% | 85 | 1.17% | -2,233 | -30.83% | 7,244 |
| Hendry | 4,751 | 46.51% | 5,355 | 52.42% | 109 | 1.07% | -604 | -5.91% | 10,215 |
| Hernando | 37,830 | 45.07% | 44,938 | 53.54% | 1,160 | 1.39% | -7,108 | -8.47% | 83,928 |
| Highlands | 16,148 | 37.96% | 25,915 | 60.92% | 478 | 1.12% | -9,767 | -22.96% | 42,541 |
| Hillsborough | 286,467 | 52.71% | 250,186 | 46.04% | 6,776 | 1.25% | 36,281 | 6.67% | 543,429 |
| Holmes | 1,264 | 15.25% | 6,919 | 83.46% | 107 | 1.29% | -5,655 | -68.21% | 8,290 |
| Indian River | 27,492 | 38.41% | 43,450 | 60.70% | 638 | 0.89% | -15,958 | -22.29% | 71,580 |
| Jackson | 7,342 | 35.02% | 13,418 | 64.00% | 207 | 0.98% | -6,076 | -28.98% | 20,967 |
| Jefferson | 3,945 | 50.45% | 3,808 | 48.70% | 67 | 0.85% | 137 | 1.75% | 7,820 |
| Lafayette | 687 | 20.17% | 2,668 | 78.33% | 51 | 1.50% | -1,981 | -58.16% | 3,406 |
| Lake | 61,799 | 40.89% | 87,643 | 57.99% | 1,702 | 1.02% | -25,844 | -17.10% | 151,144 |
| Lee | 110,157 | 41.32% | 154,163 | 57.83% | 2,278 | 0.85% | -44,006 | -16.51% | 266,598 |
| Leon | 90,881 | 61.13% | 55,805 | 37.54% | 1,985 | 1.33% | 35,076 | 23.59% | 148,671 |
| Levy | 6,119 | 33.15% | 12,054 | 65.31% | 284 | 1.54% | -5,935 | -32.16% | 18,457 |
| Liberty | 942 | 28.64% | 2,301 | 69.96% | 46 | 1.40% | -1,359 | -41.32% | 3,289 |
| Madison | 4,176 | 47.85% | 4,474 | 51.27% | 77 | 0.88% | -298 | -3.42% | 8,727 |
| Manatee | 66,503 | 43.22% | 85,627 | 55.65% | 1,736 | 1.13% | -19,124 | -12.43% | 153,866 |
| Marion | 66,831 | 41.32% | 93,043 | 57.53% | 1,864 | 1.15% | -26,212 | -16.21% | 161,738 |
| Martin | 30,107 | 38.09% | 48,183 | 60.96% | 747 | 0.95% | -18,076 | -22.87% | 79,037 |
| Miami-Dade | 541,440 | 61.58% | 332,981 | 37.87% | 4,758 | 0.55% | 208,459 | 23.71% | 879,179 |
| Monroe | 19,404 | 49.56% | 19,234 | 49.12% | 516 | 1.32% | 170 | 0.44% | 39,154 |
| Nassau | 10,251 | 25.23% | 29,929 | 73.67% | 445 | 1.10% | -19,678 | -48.44% | 40,625 |
| Okaloosa | 23,421 | 24.63% | 70,168 | 73.80% | 1,486 | 1.57% | -46,747 | -49.17% | 95,075 |
| Okeechobee | 4,856 | 39.27% | 7,328 | 59.25% | 183 | 1.48% | -2,472 | -19.98% | 12,367 |
| Orange | 273,665 | 58.56% | 188,589 | 40.36% | 5,049 | 1.08% | 85,076 | 18.20% | 467,303 |
| Osceola | 67,239 | 61.73% | 40,592 | 37.27% | 1,091 | 1.00% | 26,647 | 24.46% | 108,922 |
| Palm Beach | 349,651 | 58.14% | 247,398 | 41.13% | 4,390 | 0.73% | 102,253 | 17.01% | 601,439 |
| Pasco | 98,263 | 45.86% | 112,427 | 52.48% | 3,558 | 1.66% | -14,164 | -6.62% | 214,248 |
| Pinellas | 239,104 | 52.08% | 213,258 | 46.45% | 6,750 | 1.47% | 25,846 | 5.63% | 459,112 |
| Polk | 114,622 | 45.95% | 131,577 | 52.75% | 3,243 | 1.30% | -16,955 | -6.80% | 249,442 |
| Putnam | 11,667 | 37.13% | 19,326 | 61.50% | 431 | 1.37% | -7,659 | -24.37% | 31,424 |
| St. Johns | 35,190 | 30.59% | 78,513 | 68.25% | 1,332 | 1.16% | -43,323 | -37.66% | 115,035 |
| St. Lucie | 65,869 | 53.42% | 56,202 | 45.58% | 1,230 | 1.00% | 9,667 | 7.84% | 123,301 |
| Santa Rosa | 17,768 | 23.06% | 58,186 | 75.51% | 1,106 | 1.43% | -40,418 | -52.45% | 77,060 |
| Sarasota | 95,119 | 45.74% | 110,504 | 53.14% | 2,338 | 1.12% | -15,385 | -7.40% | 207,961 |
| Seminole | 96,445 | 46.12% | 109,943 | 52.57% | 2,732 | 1.31% | -13,498 | -6.45% | 209,120 |
| Sumter | 19,524 | 32.25% | 40,646 | 67.13% | 376 | 0.62% | -21,122 | -34.88% | 60,546 |
| Suwannee | 4,751 | 26.85% | 12,672 | 71.63% | 269 | 1.52% | -7,921 | -44.78% | 17,692 |
| Taylor | 2,764 | 30.24% | 6,249 | 68.37% | 127 | 1.39% | -3,485 | -38.13% | 9,140 |
| Union | 1,339 | 24.76% | 3,980 | 73.59% | 89 | 1.65% | -2,641 | -48.83% | 5,408 |
| Volusia | 114,748 | 48.78% | 117,490 | 49.94% | 3,016 | 1.28% | -2,742 | -1.16% | 235,254 |
| Wakulla | 5,175 | 35.21% | 9,290 | 63.21% | 232 | 1.58% | -4,115 | -28.00% | 14,697 |
| Walton | 6,671 | 23.34% | 21,490 | 75.19% | 421 | 1.47% | -14,819 | -51.85% | 28,582 |
| Washington | 2,820 | 25.54% | 8,038 | 72.79% | 184 | 1.67% | -5,218 | -47.25% | 11,042 |
| Totals | 4,237,756 | 49.90% | 4,163,447 | 49.03% | 90,972 | 1.07% | 74,309 | 0.87% | 8,492,175 |
- Counties that flipped from Democratic to Republican
- Flagler (largest city: Palm Coast)
- Volusia (largest city: Deltona)
By congressional district
Despite losing the state, Romney won 16 of 27 congressional districts including one held by a Democrat, while Obama won 11, including two held by Republicans.
| District | Romney | Obama | Representative |
|---|---|---|---|
| 1st | 68.66% | 30.18% | Jeff Miller |
| 2nd | 52.38% | 46.52% | Steve Southerland |
| 3rd | 61.5% | 37.5% | Ted Yoho |
| 4th | 63.62% | 35.45% | Ander Crenshaw |
| 5th | 28.05% | 71.23% | Corrine Brown |
| 6th | 57.7% | 41.4% | Ron DeSantis |
| 7th | 51.81% | 47.1% | John Mica |
| 8th | 56.76% | 42.18% | Bill Posey |
| 9th | 37.21% | 61.94% | Alan Grayson |
| 10th | 53.35% | 45.72% | Daniel Webster |
| 11th | 58.85% | 40.23% | Rich Nugent |
| 12th | 54.04% | 44.77% | Gus Bilirakis |
| 13th | 48.65% | 50.12% | Bill Young |
| 14th | 33.96% | 65.05% | Kathy Castor |
| 15th | 53.33% | 45.58% | Dennis Ross |
| 16th | 54.22% | 44.9% | Vern Buchanan |
| 17th | 57.88% | 41.2% | Tom Rooney |
| 18th | 51.72% | 47.56% | Patrick Murphy |
| 19th | 60.6% | 38.76% | Trey Radel |
| 20th | 16.98% | 82.16% | Alcee Hastings |
| 21st | 38.85% | 60.6% | Ted Deutch |
| 22nd | 44.93% | 54.38% | Lois Frankel |
| 23rd | 37.9% | 61.5% | Debbie Wasserman Schultz |
| 24th | 12.17% | 87.52% | Frederica Wilson |
| 25th | 50.8% | 48.7% | Mario Díaz-Balart |
| 26th | 46.35% | 53.1% | Joe Garcia |
| 27th | 46.45% | 53.05% | Ileana Ros-Lehtinen |
Analysis
Obama won the state and its 29 electoral votes on Election Day by a margin of 0.88%, down from the 2.82% margin in 2008. Florida was the closest race in the country at the presidential level. Throughout the night, Obama and Romney exchanged the lead, but the networks avoided calling the state for Obama until November 10 because long lines in the larger urban areas of the state meant that the vote count was delayed.
According to exit polling, Obama won 95% of the African-American vote (13% of voters), 60% of Latino voters (up 3 points from 2008 and 17% of all voters), and 50% among Independents (who accounted for 33% of all voters). Mitt Romney won white voters by 24 percent. In addition, both Democratic and Republican strategists agreed that the President's ground game and early voting leads played a huge role in such a tight race. Despite laws that curbed early voting, more than 4 million Floridians cast a ballot before Election Day (almost 50% of all voters), and reports showed that Obama was leading by about 104,000 among those voters.
The political geography of Florida is largely divided in thirds: South Florida (around the Miami metropolitan area) is heavily Democratic, North Florida (the Florida Panhandle, and the Jacksonville metropolitan area) is heavily Republican outside of Tallahassee and Gainesville, while Central Florida is a "swing" area of the state, where Democrats have made inroads in recent years.
Mirroring the results of the 2008 presidential election in Florida, Obama dominated South Florida, winning Miami-Dade, Broward, and Palm Beach counties by comfortable margins, and actually increased his vote share in Miami -Dade and Broward counties from 2008. However, Romney's performance in Palm Beach County was notable considering he is the first Republican presidential candidate in over a decade to receive over 40% of the county's vote. Obama's gains in South Florida have been attributed to increasing his vote share among Cuban Americans, a large demographic in and around Miami who have reliably voted Republican, from 35% in 2008 to 48% against Romney's 52% in 2012. Combined with his large margins of victory among non-Cuban Hispanics in the state, Arian Campo-Flores at The Wall Street Journal noted that, "Together, both trends are accelerating a realignment of the state's Latino vote, from once solidly Republican to now reliably Democratic."
Although Obama lost large swaths of North Florida, he was able to keep the margins relatively close along the Eastern Seaboard. He lost to Romney in Duval County, anchored by Florida's largest city, Jacksonville, by only 3%, and Volusia County, home to Daytona Beach, by less than 2%. Where the state tipped into the Obama column was in Central Florida, the site of enormous growth in the last two decades. Obama was able to deliver big wins in the Orlando and Tampa Bay areas, where George W. Bush won in 2004. In the former, Obama carried Orange County (which includes Orlando) by 19 points and Osceola County near Orlando by a 24-point margin (Bush won it in 2004 52%-47%). In both counties, he was able to tap into a growing Puerto Rican community, which overwhelmingly broke his way.
In the Tampa Bay region, Obama once again carried Hillsborough County, home to Tampa, by a 6-point margin, receiving over 13,000 more votes than he won in 2008. Obama also won Pinellas County, home to St. Petersburg, by a 52%-46.5% margin. Bush had narrowly carried the county by about 0.1% in 2004. In all, Obama won the three largest counties in Central Florida – Hillsborough, Orange, and Pinellas – while keeping his losing margins low in other populous counties – Polk, Seminole, and Manatee County.
Contrary to the 2010 elections where Democrats lost four seats from Florida in the U.S. House of Representatives, Democrats picked up four seats from Florida this time around, as the state's congressional delegation increased by 2 members. Patrick Murphy defeated incumbent Republican Allen West in Florida's 18th congressional district and Joe Garcia defeated incumbent Republican David Rivera in Florida's 26th congressional district. Democrat Alan Grayson won a new seat in Florida's 9th congressional district while former West Palm Beach mayor, Lois Frankel, won the newly created seat in Florida's 22nd congressional district for the Democrats. At the state level, Democrats picked up two seats in the Florida State Senate and five seats in the Florida House of Representatives as well.
References
- "Voter Turnout". Florida Division of Elections. 2021. Archived from the original on June 2, 2015.
- "2 Days After Election Florida Still Counting Votes". Archived from the original on November 12, 2012. Retrieved November 9, 2012.
- 'Obama wint ook in Florida' (in Dutch)
- "Barack Obama closes in on Florida vote victory". BBC News. November 9, 2012. Retrieved October 28, 2016.
- Caputo, Marc (November 8, 2012). "Obama to win Florida; becomes emotional during thank you speech". The Miami Herald.
- Weaver, Jay; Mazzei, Patricia; Morgan, Curtis (November 8, 2012). "Broward joins Miami -Dade in completing election count". The Miami Herald. Archived from the original on November 9, 2012.
- "Florida May Have Election Results By Noon Saturday". Archived from the original on November 13, 2012. Retrieved November 9, 2012.
- "It's official: Obama wins Florida". Los Angeles Times. November 10, 2012. Retrieved November 14, 2012.
- "Obama wins Florida, topping Romney in final tally". Retrieved November 14, 2012.
- "Obama's final win in Florida gives him 332 electoral votes". Reuters. November 10, 2012. Retrieved November 14, 2012.
- ^ "Florida". The New York Times. ISSN 0362-4331. Retrieved September 1, 2020.
- ^ Richard E. Berg-Andersson (December 28, 2011). "Florida Republican primary". The Green Papers. Retrieved January 14, 2012.
50 of Florida's delegates to the Republican National Convention are allocated to the Presidential contender receiving the most votes in today's Florida Presidential Primary. (Republican Party of Florida Rule 10 B).
- "GOP chairman: Florida will be penalized, and 2012 race was set | Iowa Caucuses". Caucuses.desmoinesregister.com. October 25, 2011. Retrieved January 22, 2012.
- "Gingrich memo on Florida delegate allocation". Archived from the original on February 5, 2012. Retrieved February 8, 2012.
- "County Voter Registration By Party as of Jan. 3, 2012" (PDF). Florida Division of Elections. January 15, 2012. p. 5. Retrieved January 22, 2012.
- "Florida Department of State – Election Results". Florida Department of State: Division of Elections. Retrieved February 22, 2012.
- Astor, Maggie (September 28, 2011). "Florida Primary: January Date Violates Republican Rules, Complicates Race". International Business Times. Retrieved February 6, 2012.
- O'Conner, Patrick (September 29, 2011). "Early Florida Primary Would Scramble 2012 Calendar". The Wall Street Journal. Retrieved February 5, 2012.
- "Florida primary 2012: Delegate dispute could drag on". Politico.com. Retrieved May 4, 2012.
- "Gingrich to Challenge Florida's Winner-Take-All Primary Results". nymag.com. February 2012. Retrieved May 4, 2012.
- "Gingrich Challenges Florida's Winner-Take-All Delegate Scheme". npr.org. Retrieved May 4, 2012.
- "Gingrich challenges Florida GOP winner-take-all rule in attempt to get delegates". PalmBeachPost.com. Retrieved May 4, 2012.
- "Gingrich Camp Memo Challenges Florida as Winner-Take-All; RNC Responds". FloridaConservativeNews.com. Archived from the original on February 3, 2016. Retrieved May 4, 2012.
- "RNC Member: Gingrich Could Contest Fla". nationalreview.com. National Review. Retrieved May 4, 2012.
- "Gingrich Memo "RE: Issues Surrounding Florida's Allocation of Delegates"". FoxNews.com Politics. Archived from the original on February 5, 2012. Retrieved February 2, 2012.
- "Huffington Post Election Dashboard". HuffPost. Archived from the original on August 13, 2013.
- "America's Choice 2012 Election Center: CNN Electoral Map". CNN. Archived from the original on January 19, 2013.
- "Election 2012 - The Electoral Map: Building a Path to Victory". The New York Times. Archived from the original on July 8, 2012.
- "2012 Presidential Election Results". The Washington Post. Archived from the original on July 26, 2012.
- "RealClearPolitics - 2012 Election Maps - Battle for White House". Archived from the original on June 8, 2011.
- "PROJECTION: OBAMA WILL LIKELY WIN SECOND TERM".
- "Nate Silver's political calculations predict 2012 election outcome".
- ^ Broward joins Miami-Dade in completing election count
- Leip, David. "Dave Leip's Atlas of U.S. Presidential Elections". Retrieved October 28, 2016.
- "Daily Kos Elections' statewide election results by congressional and legislative districts". Daily Kos. Retrieved August 11, 2020.
- Campo-Flores, Arian. "Cuban-Americans Move Left".
External links
- Official website of Florida's Secretary of State's office
- Official website of the Florida Republican Party
- The Green Papers: for Florida
- The Green Papers: Major state elections in chronological order
| (2011 ←) 2012 United States elections (→ 2013) | |
|---|---|
| U.S. President |
|
| U.S. Senate |
|
| U.S. House (Election ratings) |
|
| Governors | |
| Attorneys general | |
| Other statewide elections |
|
| State legislatures |
|
| Mayoral |
|
| States and territories |
|
| State and district results of the 2012 United States presidential election | ||
|---|---|---|
|  | |
| (← 2008) 2012 United States presidential election (2016 →) | |||||||||||||||||||||||||||||||
|---|---|---|---|---|---|---|---|---|---|---|---|---|---|---|---|---|---|---|---|---|---|---|---|---|---|---|---|---|---|---|---|
| Democratic Party |
| ||||||||||||||||||||||||||||||
| Republican Party |
| ||||||||||||||||||||||||||||||
| Libertarian Party |
| ||||||||||||||||||||||||||||||
| Green Party |
| ||||||||||||||||||||||||||||||
| |||||||||||||||||||||||||||||||
| United States presidential primaries and caucuses | |||||||||||||||||||
|---|---|---|---|---|---|---|---|---|---|---|---|---|---|---|---|---|---|---|---|
| Election timelines | |||||||||||||||||||
| National opinion polling | |||||||||||||||||||
| State opinion polling | |||||||||||||||||||
| Fundraising | |||||||||||||||||||
| Debates and forums | |||||||||||||||||||
| Straw polls | |||||||||||||||||||
| Major events | |||||||||||||||||||
| Caucuses and primaries |
| ||||||||||||||||||
| Results breakdown | |||||||||||||||||||
| National conventions |
| ||||||||||||||||||
| Reforms | |||||||||||||||||||


