Main article: Burnley Borough Council elections
The 2016 Burnley Borough Council election took place on 5 May 2016 to elect members of Burnley Borough Council in England. This was on the same day as other local elections. One third of the council was up for election, with each successful candidate serving a four-year term of office, expiring in 2020. These seats were last contested in 2012.
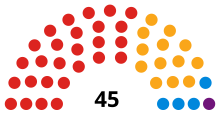
Labour remained in overall control of the council.
State of the Parties
After the election, the composition of the Council was as follows:
Party | Seats | ± | |
---|---|---|---|
Labour | 27 | 3 | |
Liberal Democrat | 13 | 3 | |
Conservative | 4 | 1 | |
UKIP | 1 | 1 |
Results
Party | Seats | Gains | Losses | Net gain/loss | Seats % | Votes % | Votes | +/− | |
---|---|---|---|---|---|---|---|---|---|
Labour | 8 | 0 | 3 | -3 | 53.3 | 44.3 | 8,873 | +6.5 | |
Liberal Democrats | 5 | 3 | 0 | +3 | 33.3 | 32.4 | 6,481 | +5.2 | |
UKIP | 1 | 1 | 0 | +1 | 6.7 | 11.5 | 2,303 | -2.8 | |
Conservative | 1 | 0 | 1 | -1 | 6.7 | 6.1 | 1,227 | -12.2 | |
Green | 0 | 0 | 0 | 0 | 0.0 | 4.0 | 806 | +2.2 | |
TUSC | 0 | 0 | 0 | 0 | 0.0 | 0.8 | 163 | +0.4 | |
BNP | 0 | 0 | 0 | 0 | 0.0 | 0.8 | 158 | +0.7 |
By ward
Bank Hall ward
Party | Candidate | Votes | % | ±% | |
---|---|---|---|---|---|
Labour | Lubna Khan | 768 | 64.8 | +12.5 | |
Liberal Democrats | Peter Michael Bradley | 417 | 35.2 | +11.9 | |
Majority | 351 | 29.6 | +1.7 | ||
Turnout | 1,185 | 29.8 | |||
Labour hold | Swing |
Briercliffe ward
Party | Candidate | Votes | % | ±% | |
---|---|---|---|---|---|
Liberal Democrats | Margaret Ann Lishman | 764 | 57.2 | +18.1 | |
UKIP | Ian Metcalf | 261 | 19.5 | −3.0 | |
Labour | Syd Khan | 176 | 13.2 | −8.7 | |
Conservative | Tom Watson | 99 | 7.4 | −6.3 | |
Green | James MacDonald | 36 | 2.7 | −0.1 | |
Majority | 503 | 37.6 | +21.0 | ||
Turnout | 1,336 | 30.8 | |||
Liberal Democrats hold | Swing |
Brunshaw ward
Party | Candidate | Votes | % | ±% | |
---|---|---|---|---|---|
Labour | Lian Pate | 600 | 48.6 | +3.2 | |
UKIP | Jamie McGowan | 452 | 36.6 | +10.3 | |
Liberal Democrats | Sandra Ann Byrne | 182 | 14.7 | −1.1 | |
Majority | 148 | 12.0 | −7.1 | ||
Turnout | 1,234 | 26.0 | |||
Labour hold | Swing |
Cliviger with Worsthorne ward
Party | Candidate | Votes | % | ±% | |
---|---|---|---|---|---|
Conservative | Andrew Robert Newhouse | 539 | 35.0 | +1.9 | |
Liberal Democrats | Kathryn Haworth | 358 | 23.2 | −1.0 | |
UKIP | Tom Commis | 349 | 22.6 | +0.2 | |
Labour | 296 | 19.2 | −1.1 | ||
Majority | 181 | 11.7 | +2.8 | ||
Turnout | 1,542 | 36.6 | |||
Conservative hold | Swing |
Coalclough with Deerplay ward
Party | Candidate | Votes | % | ±% | |
---|---|---|---|---|---|
Liberal Democrats | Bill Brindle | 721 | 65.2 | +19.0 | |
Labour | Ibrahim Ali | 299 | 27.0 | −3.2 | |
Green | Anne Whittles | 86 | 7.8 | +7.8 | |
Majority | 422 | 38.2 | 22.2 | ||
Turnout | 1,106 | 28.4 | |||
Liberal Democrats hold | Swing |
Daneshouse with Stoneyholme ward
Party | Candidate | Votes | % | ±% | |
---|---|---|---|---|---|
Labour | Saeed Akhtar Chaudhary | 1,350 | 87.7 | N/A | |
Liberal Democrats | Mubashir Aftab | 190 | 12.3 | N/A | |
Majority | 1,160 | 75.3 | N/A | ||
Turnout | 1,540 | 41.1 | |||
Labour hold | Swing |
Daneshouse with Stoneyholme returned a Labour Party (UK) councillor unopposed in 2015.
Gannow ward
Party | Candidate | Votes | % | ±% | |
---|---|---|---|---|---|
Liberal Democrats | Mark Andrew Charles Payne | 680 | 53.0 | +8.4 | |
Labour | Christine Sollis | 427 | 33.3 | −0.7 | |
BNP | Christopher Barnett | 113 | 8.8 | +8.8 | |
Green | Jai Redman | 63 | 4.9 | +4.9 | |
Majority | 253 | 19.7 | +9.2 | ||
Turnout | 1,283 | 31.2 | |||
Liberal Democrats gain from Labour | Swing |
Gawthorpe ward
Party | Candidate | Votes | % | ±% | |
---|---|---|---|---|---|
Labour | Andy Tatchell | 809 | 66.9 | +8.6 | |
Liberal Democrats | Brendan John Morris | 400 | 33.1 | +13.2 | |
Majority | 409 | 33.8 | −2.7 | ||
Turnout | 1,209 | 28.0 | |||
Labour hold | Swing |
Hapton with Park ward
Party | Candidate | Votes | % | ±% | |
---|---|---|---|---|---|
UKIP | Alan Hosker | 683 | 44.4 | +24.1 | |
Labour | Howard Leigh Hudson | 601 | 39.1 | +2.8 | |
Conservative | Ivor Christopher Emo | 173 | 11.2 | −7.6 | |
Liberal Democrats | Leslie Williams | 81 | 5.3 | −13.7 | |
Majority | 82 | 5.3 | |||
Turnout | 1,538 | 34.1 | |||
UKIP gain from Labour | Swing |
Lanehead ward
Party | Candidate | Votes | % | ±% | |
---|---|---|---|---|---|
Labour | Asif Raja | 792 | 47.8 | +2.1 | |
Liberal Democrats | Paula Christine Riley | 665 | 40.2 | +19.4 | |
Green | Laura Fisk | 199 | 12.0 | +12.0 | |
Majority | 127 | 7.7 | −17.7 | ||
Turnout | 1,656 | 37.4 | |||
Labour hold | Swing |
Queensgate ward
Party | Candidate | Votes | % | ±% | |
---|---|---|---|---|---|
Labour | Arif Khan | 811 | 57.4 | +6.2 | |
Liberal Democrats | Arthur Gordon Lishman | 438 | 31.0 | −1.6 | |
TUSC | Gavin Hartley | 163 | 11.5 | +5.4 | |
Majority | 373 | 26.4 | +7.8 | ||
Turnout | 1,412 | 35.9 | |||
Labour hold | Swing |
Rosegrove with Lowerhouse ward
Party | Candidate | Votes | % | ±% | |
---|---|---|---|---|---|
Labour | Marcus Johnstone | 590 | 49.5 | +0.7 | |
UKIP | Mark Henry Girven | 278 | 23.3 | −4.2 | |
Liberal Democrats | Stephanie Forrest | 221 | 18.6 | −2.8 | |
Green | Ceri Jane Carmichael | 57 | 4.8 | +1.4 | |
BNP | Christopher Vanns | 45 | 3.8 | +2.0 | |
Majority | 312 | 26.2 | +7.9 | ||
Turnout | 1,191 | 26.4 | |||
Labour hold | Swing |
Rosehill with Burnley Wood ward
Party | Candidate | Votes | % | ±% | |
---|---|---|---|---|---|
Liberal Democrats | Christine Eleanor White | 625 | 47.2 | +14.5 | |
Labour | Paul Campbell | 587 | 44.3 | +11.3 | |
Green | Georgina Hannah Ormrod | 112 | 8.5 | +3.7 | |
Majority | 38 | 2.9 | +2.6 | ||
Turnout | 1,324 | 30.9 | |||
Liberal Democrats gain from Labour | Swing |
Trinity ward
Party | Candidate | Votes | % | ±% | |
---|---|---|---|---|---|
Labour Co-op | Tony Martin | 452 | 49.8 | +1.5 | |
Liberal Democrats | Stewart Bone | 236 | 26.0 | −0.3 | |
Green | Andy Fewings | 219 | 24.1 | +24.1 | |
Majority | 216 | 23.8 | +1.4 | ||
Turnout | 907 | 24.1 | |||
Labour hold | Swing |
Whittlefield with Ightenhill ward
Party | Candidate | Votes | % | ±% | |
---|---|---|---|---|---|
Liberal Democrats | David Roper | 503 | 32.5 | +9.7 | |
Conservative | Tony Moores | 416 | 26.9 | −6.9 | |
Labour | Andy Devanney | 316 | 20.4 | −2.6 | |
UKIP | Chris Rawson | 280 | 18.1 | −2.3 | |
Green | Alfie Jones | 34 | 2.2 | +2.2 | |
Majority | 87 | 5.6 | −5.2 | ||
Turnout | 1,548 | 33.5 | |||
Liberal Democrats gain from Conservative | Swing |
References
- "Guide to May 2016 elections in Scotland, Wales, England and Northern Ireland". BBC News. Retrieved 21 April 2016.
- "Results 2016". burnley.gov.uk. Burnley Borough Council. Retrieved 7 May 2016.
Council elections in Lancashire | |
---|---|
Lancashire County Council | |
Blackburn with Darwen | |
Blackpool | |
Burnley | |
Chorley | |
Fylde | |
Hyndburn | |
Lancaster | |
Pendle | |
Preston | |
Ribble Valley | |
Rossendale | |
South Ribble | |
West Lancashire | |
Wyre | |
|