| |||||||||||||||||||
| |||||||||||||||||||
 Results by county Results by countySanders: 40-50% 50-60% 60-70% Clinton: 40-50% 50-60% | |||||||||||||||||||
The 2016 Oklahoma Democratic presidential primary took place on March 1 in the U.S. state of Oklahoma as one of the Democratic Party's primaries ahead of the 2016 presidential election.
On the same day, dubbed "Super Tuesday," Democratic primaries were held in ten other states plus American Samoa, while the Republican Party held primaries in eleven states including their own Oklahoma primary.
Opinion polling
See also: Statewide opinion polling for the 2016 Democratic Party presidential primaries| Poll source | Date | 1st | 2nd | 3rd | Other |
|---|---|---|---|---|---|
| Official Primary results | March 1, 2016 | Bernie Sanders 51.9% |
Hillary Clinton 41.5% |
Others 6.6% | |
| Monmouth
Margin of error: ± 5.7%
|
February 25–28, 2016 | Bernie Sanders 48% |
Hillary Clinton 43% |
Others / Undecided 9% | |
| Sooner Poll/News 9/News on 6
Margin of error: ± 4.3%
|
February 23–25, 2016 | Hillary Clinton 40% |
Bernie Sanders 31% |
Others / Undecided 29% | |
| Public Policy Polling
Margin of error: ± 4.2%
|
February 14–16, 2016 |
Hillary Clinton 46% |
Bernie Sanders 44% |
Undecided 9% | |
| Sooner Poll
Margin of error: ± 5.0%
|
February 6–9, 2016 | Hillary Clinton 43.9% |
Bernie Sanders 28% |
Undecided 28.1% | |
| Sooner Poll
Margin of error: ± 5.1%
|
November 12–15, 2015 | Hillary Clinton 46.6% |
Bernie Sanders 12.2% |
Martin O'Malley 2.2% |
Undecided 39.1% |
| The Oklahoman/Cole Hargrave Snodgrass & Associates
Margin of error: ± 4.3%
|
October 19–22, 2015 | Hillary Clinton 30% |
Bernie Sanders 21% |
Martin O'Malley 1% |
Undecided 46% |
Results
See also: Results of the Democratic Party presidential primaries, 2016Primary date: March 1, 2016
National delegates: 91
| Oklahoma Democratic primary, March 1, 2016 | |||||
|---|---|---|---|---|---|
| Candidate | Popular vote | Estimated delegates | |||
| Count | Percentage | Pledged | Unpledged | Total | |
| Bernie Sanders | 174,228 | 51.88% | 21 | 1 | 22 |
| Hillary Clinton | 139,443 | 41.52% | 17 | 1 | 18 |
| Martin O'Malley (withdrawn) | 7,672 | 2.28% | |||
| Keith Judd | 4,386 | 1.31% | |||
| Michael Steinberg | 4,171 | 1.24% | |||
| Star Locke (withdrawn) | 3,458 | 1.03% | |||
| Rocky De La Fuente | 2,485 | 0.74% | |||
| Uncommitted | — | 0 | 2 | 2 | |
| Total | 335,843 | 100% | 38 | 4 | 42 |
| Source: | |||||
Results by county
| County | Clinton | Votes | Sanders | Votes |
|---|---|---|---|---|
| Adair | 33.4% | 582 | 55.8% | 971 |
| Alfalfa | 28.0% | 92 | 58.1% | 191 |
| Atoka | 28.4% | 370 | 55.4% | 723 |
| Beaver | 28.9% | 52 | 52.2% | 94 |
| Beckham | 31.2% | 464 | 55.4% | 824 |
| Blaine | 37.3% | 313 | 51.8% | 435 |
| Bryan | 31.2% | 1,050 | 56.8% | 1,913 |
| Caddo | 36.4% | 1,060 | 53.0% | 1,543 |
| Canadian | 38.4% | 3,357 | 56.3% | 4,922 |
| Carter | 32.3% | 1,240 | 55.0% | 2,113 |
| Cherokee | 38.7% | 2,023 | 55.4% | 2,897 |
| Choctaw | 29.0% | 384 | 56.4% | 745 |
| Cimarron | 17.5% | 22 | 54.0% | 68 |
| Cleveland | 37.6% | 10,433 | 59.3% | 16,428 |
| Coal | 19.0% | 136 | 63.6% | 456 |
| Comanche | 44.9% | 3,523 | 48.5% | 3,804 |
| Cotton | 29.7% | 204 | 56.4% | 388 |
| Craig | 35.8% | 609 | 54.5% | 926 |
| Creek | 35.8% | 609 | 50.9% | 926 |
| Custer | 33.6% | 750 | 57.1% | 1,273 |
| Delaware | 41.2% | 1,447 | 50.5% | 1,773 |
| Dewey | 27.5% | 134 | 55.4% | 270 |
| Ellis | 23.3% | 70 | 64.1% | 193 |
| Garfield | 41.3% | 1,403 | 52.2% | 1,771 |
| Garvin | 32.7% | 909 | 54.1% | 1,505 |
| Grady | 34.2% | 1,629 | 56.2% | 2,677 |
| Grant | 31.9% | 125 | 57.1% | 224 |
| Greer | 27.6% | 164 | 55.8% | 332 |
| Harmon | 37.2% | 122 | 50.9% | 167 |
| Harper | 26.1% | 68 | 57.9% | 151 |
| Haskell | 32.8% | 475 | 51.9% | 752 |
| Hughes | 33.0% | 537 | 53.7% | 873 |
| Jackson | 38.6% | 505 | 49.8% | 652 |
| Jefferson | 29.4% | 197 | 51.7% | 347 |
| Johnston | 24.8% | 260 | 57.8% | 606 |
| Kay | 38.5% | 1,288 | 53.5% | 1,791 |
| Kingfisher | 33.2% | 268 | 58.5% | 472 |
| Kiowa | 34.8% | 331 | 54.0% | 514 |
| Latimer | 31.2% | 499 | 53.3% | 852 |
| Le Flore | 33.1% | 1,498 | 50.5% | 2,283 |
| Lincoln | 38.5% | 1,161 | 53.8% | 1,623 |
| Logan | 42.1% | 1,314 | 52.7% | 1,645 |
| Love | 32.0% | 314 | 51.1% | 502 |
| Major | 34.7% | 140 | 53.2% | 215 |
| Marshall | 30.3% | 400 | 56.0% | 738 |
| Mayes | 40.0% | 1,659 | 51.7% | 2,144 |
| McClain | 35.4% | 1,157 | 57.1% | 1,865 |
| McCurtain | 28.3% | 712 | 52.3% | 1,314 |
| McIntosh | 40.2% | 1,022 | 49.6% | 1,261 |
| Murray | 32.7% | 544 | 54.6% | 909 |
| Muskogee | 44.8% | 3,381 | 46.6% | 3,515 |
| Noble | 35.3% | 362 | 54.8% | 562 |
| Nowata | 38.2% | 406 | 49.9% | 530 |
| Okfuskee | 36.9% | 421 | 52.3% | 1,261 |
| Oklahoma | 50.1% | 34,255 | 47.4% | 32,368 |
| Okmulgee | 45.7% | 1,867 | 46.1% | 1,882 |
| Osage | 47.5% | 2,390 | 46.2% | 2,327 |
| Ottawa | 39.3% | 972 | 50.1% | 1,238 |
| Pawnee | 40.5% | 603 | 51.1% | 762 |
| Payne | 38.9% | 2,622 | 56.7% | 3,829 |
| Pittsburg | 31.6% | 1,717 | 55.8% | 3,026 |
| Pontotoc | 29.6% | 1,186 | 59.8% | 2,392 |
| Pottawatomie | 37.5% | 2,300 | 55.5% | 3,400 |
| Pushmataha | 26.7% | 317 | 56.1% | 667 |
| Roger Mills | 21.6% | 100 | 58.0% | 268 |
| Rogers | 39.6% | 2,810 | 52.9% | 3,757 |
| Seminole | 36.0% | 932 | 50.1% | 1,194 |
| Sequoyah | 36.0% | 1,359 | 49.6% | 1,872 |
| Stephens | 31.2% | 1,174 | 56.1% | 2,108 |
| Texas | 31.7% | 267 | 46.7% | 393 |
| Tillman | 33.2% | 214 | 53.7% | 346 |
| Tulsa | 47.4% | 25,372 | 49.6% | 26,525 |
| Wagoner | 43.5% | 2,493 | 49.1% | 2,813 |
| Washington | 42.4% | 1,649 | 51.6% | 2,006 |
| Washita | 25.1% | 292 | 60.1% | 700 |
| Woods | 33.8% | 217 | 56.5% | 363 |
| Woodward | 30.8% | 343 | 62.4% | 694 |
| Total | 41.5% | 139,338 | 51.9% | 174,054 |
Analysis
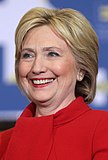
As he had managed in other primarily white Great Plains states including neighboring Kansas, Bernie Sanders won a convincing ten-point victory in Oklahoma. This marked a clear difference from 2008 when Hillary Clinton had won the state by 21 points against Barack Obama, winning 76 of the state's 77 counties. According to exit polls, Sanders won men 60-33, younger voters 76-23, white voters 56-36, and Independent voters 69-21. Clinton, for her part, won women 48-46, older voters 50-41, non-white voters 56-40, and Democrats 52-43. A majority of voters in the primary said they thought Clinton was not honest or trustworthy, 51-47.
Sanders swept 75 of Oklahoma's 77 counties. He performed strongly in the major cities of Norman, Stillwater, Enid, and Moore. He narrowly edged out Clinton in Tulsa County by a margin of 2.28%. Clinton narrowly won in Oklahoma County (the only county to vote for Obama in the 2008 primary), home to Oklahoma City, and Osage County, home of the Osage Native American tribe.
Sanders won most of the rural, majority white and deeply conservative counties of the state, including those in the Oklahoma Panhandle, Little Dixie, and Southwestern Oklahoma which are among the most radically conservative areas of the nation. The Little Dixie region in particular was the base of President Bill Clinton's support in the 1992 and 1996 elections, as this area consists of socially conservative but economically liberal Democrats, many of whom were drawn to Sanders's opposition to trade deals like NAFTA.
References
- Official Primary results
- "Monmouth University Poll" (PDF).
- "News9/Newson6: Sanders Closes Gap, But Still Trails Clinton In OK".
- Silas Allen. "Poll shows Democratic primary race tightening in Oklahoma".
- Madison Grady. "SoonerPoll: Clinton remains frontrunner, but Sanders continues to rise".
- "EXCLUSIVE POLL: Trump, Clinton Remain Front-runners in Oklahoma". November 20, 2015.
- "Poll: Ben Carson leads Republican presidential field in Oklahoma". Retrieved October 29, 2015.
- The Green Papers
- Oklahoma State Election Board
- ^ "2016 Election Center". CNN. Retrieved June 4, 2018.
| (← 2012) 2016 Democratic presidential primaries (2020 →) | |
|---|---|
| States |
|
| Others | |


