| This article includes a list of references, related reading, or external links, but its sources remain unclear because it lacks inline citations. Please help improve this article by introducing more precise citations. (November 2023) (Learn how and when to remove this message) |
The economic production quantity model (also known as the EPQ model) determines the quantity a company or retailer should order to minimize the total inventory costs by balancing the inventory holding cost and average fixed ordering cost. The EPQ model was developed and published by E. W. Taft, a statistical engineer working at Winchester Repeating Arms Company in New Haven, Connecticut, in 1918.
This method is an extension of the economic order quantity model (also known as the EOQ model). The difference between these two methods is that the EPQ model assumes the company will produce its own quantity or the parts are going to be shipped to the company while they are being produced, therefore the orders are available or received in an incremental manner while the products are being produced. While the EOQ model assumes the order quantity arrives complete and immediately after ordering, meaning that the parts are produced by another company and are ready to be shipped when the order is placed.
In some literature, the term "economic manufacturing quantity" model (EMQ) is used for "economic production quantity" model (EPQ). Similar to the EOQ model, EPQ is a single product lot scheduling method. A multiproduct extension to these models is called product cycling problem.
Overview
EPQ only applies where the demand for a product is constant over the year and that each new order is delivered/produced incrementally when the inventory reaches zero. There is a fixed cost charged for each order placed, regardless of the number of units ordered. There is also a holding or storage cost for each unit held in storage (sometimes expressed as a percentage of the purchase cost of the item).
We want to determine the optimal number of units of the product to order so that we minimize the total cost associated with the purchase, delivery and storage of the product.
The required parameters to the solution are the total demand for the year, the purchase cost for each item, the fixed cost to place the order and the storage cost for each item per year. Note that the number of times an order is placed will also affect the total cost, however, this number can be determined from the other parameters
Assumptions
- Demand for items from inventory is continuous and at a constant rate
- Production runs to replenish inventory are made at regular intervals
- During a production run, the production of items is continuous and at a constant rate
- Production set-up/ordering cost is fixed (independent of quantity produced)
- The lead time is fixed
- The purchase price of the item is constant, i.e. no discount is available
- The replenishment is made incrementally
Variables
- K = ordering/setup cost per production run
- D = yearly demand rate
- h = yearly holding cost per product
- t = cycle length
- P = yearly production rate
- Q = order quantity
- S = success by the method.
Total cost function and derivation of EPQ formula

- Holding Cost per Year =
Where is the average inventory level, and is the average holding cost. Therefore, multiplying these two results in the holding cost per year.
- Ordering Cost per Year =
Where are the orders placed in a year, multiplied by K results in the ordering cost per year.
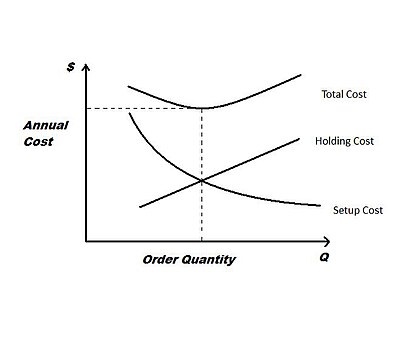
We can notice from the equations above that the total ordering cost decreases as the production quantity increases. Inversely, the total holding cost increases as the production quantity increases. Therefore, in order to get the optimal production quantity we need to set holding cost per year equal to ordering cost per year and solve for quantity (Q), which is the EPQ formula mentioned below. Ordering this quantity will result in the lowest total inventory cost per year.
EPQ formula
Relevant formulas
- Average holding cost per unit time:
- Average ordering and holding cost as a function of time:
See also
- Reorder point
- Safety stock
- Infinite fill rate for the part being produced: Economic order quantity
- Demand is random, continuous replenishment: Base stock model
- Demand varies over time: Dynamic lot size model
- Several products produced on the same machine: Economic lot scheduling problem
References
- Taft, E. W., The most economical production lot: Formulas for Exact and Approximate Evaluation - Handling Cost of Jigs and Interest Charges of Product Included, Iron Age 101.18 (1918): pages 1410-1412, accessed 29 November 2023
Sources
- Gallego, G. "IEOR4000: Production Management" (Lecture 2), Columbia (2004).
- Stevenson, W. J. "Operations Management" PowerPoint slide 19, The McGraw-Hill Companies (2005).
- Kroeger, D. R. "Determining Economic Production in a Continuous Process" IIE Process Industries Webinar, IIE (2009).
- Cárdenas-Barrón, L. E. "The Economic Production Quantity derived Algebraically" International Journal of Production Economics, Volume 77, Issue 1, (2002).
- Blumenfeld, D. "Inventory" Operations Research Calculations Handbook, Florida (2001)
- Harris, F.W., "How Many Parts To Make At Once", Factory, The Magazine of Management, 10(2), 135-136, 152 (1913).


 is the average inventory level, and
  is the average holding cost. Therefore, multiplying these two results in the holding cost per year.

 are the orders placed in a year, multiplied by K results in the ordering cost per year.


