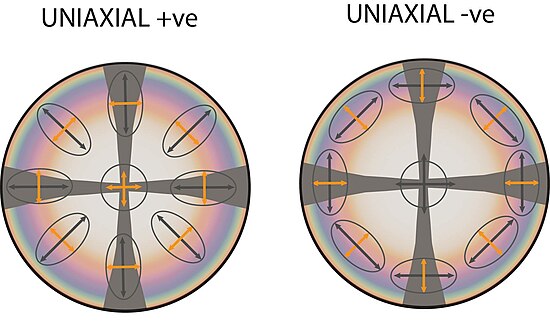
A conoscopic interference pattern or interference figure is a pattern of birefringent colours crossed by dark bands (or isogyres), which can be produced using a geological petrographic microscope for the purposes of mineral identification and investigation of mineral optical and chemical properties. The figures are produced by optical interference when diverging light rays travel through an optically non-isotropic substance – that is, one in which the substance's refractive index varies in different directions within it. The figure can be thought of as a "map" of how the birefringence of a mineral would vary with viewing angle away from perpendicular to the slide, where the central colour is the birefringence seen looking straight down, and the colours further from the centre equivalent to viewing the mineral at ever increasing angles from perpendicular. The dark bands correspond to positions where optical extinction (apparent isotropy) would be seen. In other words, the interference figure presents all possible birefringence colours for the mineral at once.
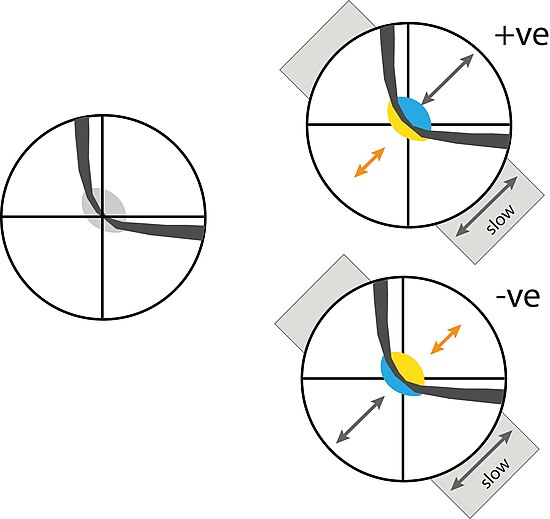
Viewing the interference figure is a foolproof way to determine if a mineral is optically uniaxial or biaxial. If the figure is aligned correctly, use of a sensitive tint plate in conjunction with the microscope allows the user to determine mineral optic sign and optic angle.
Creation of a figure
In optical mineralogy, a petrographic microscope and cross-polarised light are often used to view the interference pattern. The thin section containing the mineral to be investigated is placed on the microscope stage, above one linear polariser, but with a second (the "analyser") between the objective lens and the eyepiece. The microscope's condenser is brought up close underneath the specimen to produce a wide divergence of polarised rays through a small point, and light intensity increased as much as possible (e.g., turning up the bulb and opening the diaphragm). A high power objective lens is typically used. This both maximises the solid angle subtended by the lens, and hence the angular variation of the light intercepted, and also increases the likelihood that only a single crystal will be viewed at any given time.
To view the figure, the light rays leaving the microscope must emerge more or less in parallel. This is typically achieved either by pulling out the eyepiece altogether (if possible), or by placing a Bertrand lens (Emile Bertrand, 1878) between the objective lens and the eyepiece.
Any crystal section can in principle produce an interference pattern. However, in practice, only a few different crystallographic orientations are both 1. convenient to identify, to allow a figure to be produced, and 2. able to produce reliable information about crystal properties. Typically, the most useful and easily obtainable orientation is one looking down the optic axis of a crystal section, which yields a figure referred to as an optic axis figure (see below). Such crystal orientations are findable in thin section by looking for slices through minerals which are not isotropic but that nevertheless appear uniformly black or very dark grey under normal cross-polarised light at all stage angles (i.e., are "extinct"). If you are far from looking down an optic axis, a flash figure may be seen – a higher order birefringence colour, interrupted four times as the stage is rotated through 360 degrees by "flashes" of black which sweep across the field of view.
Characteristic figures of uniaxial and biaxial minerals

An interference figure produced looking straight down or close to the optic axis of a uniaxial mineral will show a characteristic "Maltese" cross shape to its isogyres. If you are looking perfectly down the optic axis, the pattern will remain completely unchanging as the stage is rotated. However, if the viewing angle is slightly away from the optic axis, the centre of the cross will revolve/orbit around the central point as the stage is rotated. The form of the cross will stay constant as it moves.

The optic axis figure of a biaxial mineral is more complex. One or two curved isogyres (sometimes called "brushes") will be visible, one of which will have its point of maximum curvature perfectly centred. (The figure shows an example with a single isogyre visible.) If two isogyres are visible, they will be positioned back-to-back. Rotating the stage will cause the isogyres to move and change shape strikingly – moving from a position where the isogyres curve smoothly and are widely separated at their closest point, then gradually becoming more tightly curved/squarer at their midpoints as they approach each other (a second isogyre appearing from out of the field of view if it was absent before), then merging to form a maltese cross pattern very much like that of a uniaxial mineral. Continuing to rotate the stage will cause the isogyres to separate again – but into the opposite quadrants to where they were previously – then meet again, then separate again into their original quadrants, and so on. The isogyres will touch each other four times in one 360 degree revolution, with each time corresponding to one of the extinction positions seen in normal cross polarised light.
The maximum separation between isogyres occurs when the slide is rotated exactly 45 degrees from one of the orientations where the isogyres come together. The point where the isogyres is most tightly curved represents the position of each of the two optic axes present for a biaxial mineral, and thus the maximum separation between the two curves is diagnostic of the angle between the two optic axes for the mineral. This angle is called the optic angle and often notated as "2V". In some cases, knowing the optic angle can be a useful diagnostic tool to discriminate between two minerals which otherwise look very similar. In other cases, 2V varies with chemical composition in a known way for a given mineral, and its measured value can be used to estimate ratios between elements in the crystal structure – for example, Fe/Mg in olivines. However, in these cases it becomes important to also be sure of the optic sign of the mineral (essentially, this tells you how the optic angle is orientated with respect to the whole optical indicatrix describing the refractive indices of the mineral in 3D). The optic sign and optic angle can be determined together by combining interference pattern microscopy with use of a sensitive tint plate.
On either side of the "saddle" formed by the isogyres, birefringent rings of colour run concentrically around two eye like shapes called melatopes. The closest bands are circles, but further out they become pear shaped with the narrow part pointing to the saddle. The larger bands surrounding the saddle and both melatopes are figure 8 shaped.
A Michel-Levy Chart is often used in conjunction with the interference pattern to determine useful information that aids in the identification of minerals.
See also
References
- Hartshorne, N. H.; Stuart, A. (1964). Practical Optical Crystallography. London: Edward Arnold. pp. 210–211.
- W.D. Nesse (1991). Introduction of Optical Mineralogy (2nd ed.).
- Albert Johannsen (1914). Manual of Petrographic Methods.