| Luding County 泸定县 · ལྕགས་ཟམ་རྫོང་།Chagsam, Jagsam | |
|---|---|
| County | |
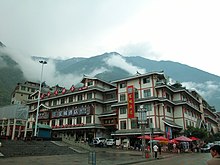
 Luding Bridge crossing the Dadu River Luding Bridge crossing the Dadu River | |
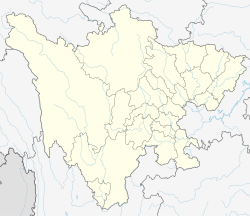
 Location of Luding County (red) within Garzê Prefecture (yellow) and Sichuan Location of Luding County (red) within Garzê Prefecture (yellow) and Sichuan | |
  | |
| Coordinates: 29°54′50″N 102°14′02″E / 29.914°N 102.234°E / 29.914; 102.234 | |
| Country | China |
| Province | Sichuan |
| Prefecture-level city | Garzê |
| County seat | Luqiao |
| Area | |
| • Total | 2,165.35 km (836.05 sq mi) |
| Population | |
| • Total | 86,234 |
| • Density | 40/km (100/sq mi) |
| • Major nationalities | Han - 78.2% Tibetan - 16.0% Yi - 4.8% |
| Time zone | UTC+8 (China Standard) |
| Postal code | 626100 |
| Area code | 0836 |
| Website | www |
| Luding County | |||||||
|---|---|---|---|---|---|---|---|
| Chinese name | |||||||
| Simplified Chinese | 泸定县 | ||||||
| Traditional Chinese | 瀘定縣 | ||||||
| |||||||
| Tibetan name | |||||||
| Tibetan | ལྕགས་ཟམ་རྫོང་། | ||||||
| |||||||
Luding County (simplified Chinese: 泸定县; traditional Chinese: 瀘定縣; pinyin: Lúdìng Xiàn), also known via its Tibetan name as Chagsam or Jagsam (Tibetan: ལྕགས་ཟམ་རྫོང་།, Wylie: lcags zam rdzong, ZYPY: Jagsam Zong), is a county located in the southeast of the Garzê Tibetan Autonomous Prefecture in Sichuan province, China. Luding County covers an area of 2,165.35 km (836.05 sq mi), and has a population of 86,234 as of 2022.
History
Main article: 2022 Luding earthquakeGeography
Luding County is bordered by Tianquan County, Yingjing County, and Hanyuan County to the east, Shimian County to the south, and Kangding to the west and north.
The county is located within the Hengduan Mountains, within the southeastern edge of the Tibetan Plateau. The town of Luqiao, the county seat, sits at an elevation of 1,321 metres (4,334 ft) above sea level. The highest point in the county is Mount Gongga, along the southwestern border with Kangding. Mount Erlang is also located on the county's edge.
Climate
| Climate data for Luding, elevation 1,403 m (4,603 ft), (1991–2020 normals, extremes 1981–2010) | |||||||||||||
|---|---|---|---|---|---|---|---|---|---|---|---|---|---|
| Month | Jan | Feb | Mar | Apr | May | Jun | Jul | Aug | Sep | Oct | Nov | Dec | Year |
| Record high °C (°F) | 23.4 (74.1) |
29.4 (84.9) |
36.3 (97.3) |
35.5 (95.9) |
36.3 (97.3) |
36.3 (97.3) |
37.8 (100.0) |
36.1 (97.0) |
34.9 (94.8) |
30.6 (87.1) |
26.3 (79.3) |
22.0 (71.6) |
37.8 (100.0) |
| Mean daily maximum °C (°F) | 12.2 (54.0) |
15.4 (59.7) |
19.2 (66.6) |
24.0 (75.2) |
25.9 (78.6) |
26.9 (80.4) |
28.7 (83.7) |
28.4 (83.1) |
25.6 (78.1) |
21.5 (70.7) |
18.0 (64.4) |
13.4 (56.1) |
21.6 (70.9) |
| Daily mean °C (°F) | 6.7 (44.1) |
9.4 (48.9) |
12.8 (55.0) |
17.0 (62.6) |
19.5 (67.1) |
21.1 (70.0) |
22.8 (73.0) |
22.5 (72.5) |
20.1 (68.2) |
16.4 (61.5) |
12.5 (54.5) |
7.9 (46.2) |
15.7 (60.3) |
| Mean daily minimum °C (°F) | 2.9 (37.2) |
5.2 (41.4) |
8.4 (47.1) |
12.3 (54.1) |
15.3 (59.5) |
17.3 (63.1) |
19.0 (66.2) |
18.9 (66.0) |
16.8 (62.2) |
13.3 (55.9) |
8.9 (48.0) |
4.2 (39.6) |
11.9 (53.4) |
| Record low °C (°F) | −4.2 (24.4) |
−3.5 (25.7) |
−2.4 (27.7) |
3.4 (38.1) |
6.0 (42.8) |
10.6 (51.1) |
13.2 (55.8) |
11.7 (53.1) |
9.9 (49.8) |
5.3 (41.5) |
0.2 (32.4) |
−3.2 (26.2) |
−4.2 (24.4) |
| Average precipitation mm (inches) | 0.8 (0.03) |
2.9 (0.11) |
17.8 (0.70) |
44.8 (1.76) |
75.8 (2.98) |
123.0 (4.84) |
143.4 (5.65) |
142.3 (5.60) |
86.6 (3.41) |
33.9 (1.33) |
6.3 (0.25) |
1.0 (0.04) |
678.6 (26.7) |
| Average precipitation days (≥ 0.1 mm) | 1.0 | 2.3 | 9.0 | 14.2 | 16.8 | 20.8 | 20.4 | 19.8 | 17.3 | 11.3 | 4.5 | 1.4 | 138.8 |
| Average snowy days | 1.4 | 1.0 | 0.3 | 0 | 0 | 0 | 0 | 0 | 0 | 0 | 0.1 | 0.5 | 3.3 |
| Average relative humidity (%) | 53 | 51 | 55 | 59 | 65 | 74 | 76 | 76 | 76 | 72 | 64 | 58 | 65 |
| Mean monthly sunshine hours | 113.9 | 108.3 | 114.2 | 126.1 | 116.8 | 91.1 | 110.1 | 115.7 | 88.0 | 91.4 | 106.9 | 108.5 | 1,291 |
| Percent possible sunshine | 35 | 34 | 31 | 33 | 28 | 22 | 26 | 29 | 24 | 26 | 34 | 34 | 30 |
| Source: China Meteorological Administration | |||||||||||||
| Climate data for Lan'an Township (1991–2018 normals) | |||||||||||||
|---|---|---|---|---|---|---|---|---|---|---|---|---|---|
| Month | Jan | Feb | Mar | Apr | May | Jun | Jul | Aug | Sep | Oct | Nov | Dec | Year |
| Mean daily maximum °C (°F) | 6.9 (44.4) |
9.4 (48.9) |
13.3 (55.9) |
17.5 (63.5) |
19.8 (67.6) |
20.9 (69.6) |
23.1 (73.6) |
22.8 (73.0) |
19.4 (66.9) |
15.1 (59.2) |
12.0 (53.6) |
8.2 (46.8) |
15.7 (60.3) |
| Daily mean °C (°F) | 1.6 (34.9) |
3.9 (39.0) |
7.6 (45.7) |
11.9 (53.4) |
14.5 (58.1) |
16.4 (61.5) |
18.8 (65.8) |
18.3 (64.9) |
15.2 (59.4) |
10.9 (51.6) |
6.9 (44.4) |
2.9 (37.2) |
10.7 (51.3) |
| Mean daily minimum °C (°F) | −3.7 (25.3) |
−1.5 (29.3) |
2.0 (35.6) |
6.2 (43.2) |
9.1 (48.4) |
12.0 (53.6) |
14.4 (57.9) |
13.8 (56.8) |
11.1 (52.0) |
6.7 (44.1) |
1.7 (35.1) |
−2.3 (27.9) |
5.8 (42.4) |
| Average precipitation mm (inches) | 5.6 (0.22) |
7.9 (0.31) |
18.2 (0.72) |
47.5 (1.87) |
93.4 (3.68) |
171.6 (6.76) |
149.5 (5.89) |
134.5 (5.30) |
126.1 (4.96) |
59.6 (2.35) |
15.0 (0.59) |
6.4 (0.25) |
835.3 (32.9) |
| Source: Baidu | |||||||||||||
Administrative divisions
As of 2022, Luding County contains the following eight towns and one township:
| Name | Simplified Chinese | Hanyu Pinyin | Tibetan | Wylie | Administrative division code | |
|---|---|---|---|---|---|---|
| Towns | ||||||
| Luqiao Town (Jagsam) |
泸桥镇 | Lúqiáo Zhèn | ལྕགས་ཟམ་གྲོང་རྡལ། | lcags zam grong rdal | 513322100 | |
| Linqi Town (Lengqi) |
冷碛镇 | Lěngqì Zhèn | ལིན་ཆིས་གྲོང་རྡལ། | lin chis grong rdal | 513322101 | |
| Xinglong Town (Xinlung) |
兴隆镇 | Xīnglóng Zhèn | ཞིན་ལུང་གྲོང་རྡལ། | zhin lung grong rdal | 513322102 | |
| Boxab Town (Moxi) |
磨西镇 | Móxī Zhèn | འབོ་ཞབས་གྲོང་རྡལ། | 'bo zhabs grong rdal | 513322103 | |
| Kugdalung Town (Kugdalungba, Yanzigou) |
燕子沟镇 | Yànzigōu Zhèn | ཁུག་རྟ་ལུང་གྲོང་རྡལ། | khug rta lung grong rdal | 513322104 | |
| Dêtog Town (Detuo) |
得妥镇 | Détuǒ Zhèn | བདེ་ཐོག་གྲོང་རྡལ། | bde thog grong rdal | 513322105 | |
| Pumba Town (Pingpa, Pengba) |
烹坝镇 | Pēngbà Zhèn | བུམ་པ་གྲོང་རྡལ། | bum pa grong rdal | 513322106 | |
| Dêwê Town (Dewei) |
德威镇 | Déwēi Zhèn | ཏེ་ཝེ་གྲོང་རྡལ། | te we grong rdal | 513322107 | |
| Township | ||||||
| La'ngoi Township (Lan'an) |
岚安乡 | Lán'ān Xiāng | ལ་ངོས་ཤང་། | la ngos shang | 513322200 | |
Demographics

Luding County has a total population of 86,234 as of 2022, up from approximately 80,000 at the end of 2004, and the 77,855 recorded in the 2000 Chinese Census.
Ethnic groups
Luding County has a supermajority Han Chinese population, but is home to a number of ethnic minorities, who constitute about 22% of the county's population. The county's ethnic minorities include Tibetans, Yi, Qiang, Miao, Hui, Mongols, Tujia, Lisu, Manchus, Yao, Kam, Nakhi, Bouyei, Bai, Zhuang, and the Dai.
The following table shows the ethnic composition of Luding County:
| 2000 | 2022 | ||||
|---|---|---|---|---|---|
| Ethnic Group | Population | Percentage | Ethnic Group | Population | Percentage |
| Han | 66,066 | 84.86% | Han | ~67,435 | 78.2% |
| Tibetan | 7,834 | 10.06% | Tibetan | ~13,797 | 16.0% |
| Yi | 3,424 | 4.4% | Yi | ~4,139 | 4.8% |
| Mongols | 253 | 0.32% | Mongols | N/A | N/A |
| Others | 278 | 0.36% | Others | 863 | 1.0% |
Transport
References
- ^ 泸定简介 [Luding Introduction]. luding.gov.cn (in Chinese). Luding County People's Government. Archived from the original on 2022-09-05. Retrieved 2022-09-05.
- 中国气象数据网 – WeatherBk Data (in Simplified Chinese). China Meteorological Administration. Retrieved 14 April 2023.
- 中国气象数据网 (in Simplified Chinese). China Meteorological Administration. Retrieved 14 April 2023.
- "泸定县岚安乡历史气候数据(甘孜藏族自治州)月尺度温度和降雨量(1961-2018年) - 百度文库". Baidu Library (in Simplified Chinese). Baidu. Retrieved 27 October 2024.
- 2021年统计用区划代码(泸定县). 2021 Statistical Division Codes (Luding County) (in Chinese). National Bureau of Statistics of China. Archived from the original on 2022-07-14. Retrieved 2022-09-05.
External links
| Garzê Tibetan Autonomous Prefecture | ||
|---|---|---|
| County-level divisions |   | |
| Towns and villages |
| |
| Geography | ||
| Landmarks | ||
| Sciences | Sichuan-Tibet Networking Project | |