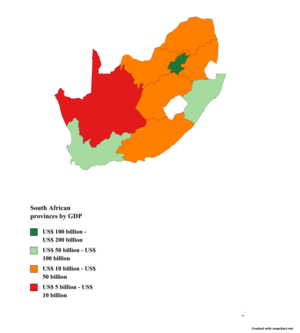
This article lists the provinces of South Africa by their gross regional domestic product (GDP).

| Rank | Province | GDP (2022; billion ZAR) | GDP (2022; billion US$) | GDP per capita (2022; US$) |
|---|---|---|---|---|
| 1 | Gauteng | 2,197.104 | 134.682 | 8,920 |
| 2 | KwaZulu-Natal | 1,055.386 | 64.695 | 5,210 |
| 3 | Western Cape | 918.203 | 56.286 | 7,572 |
| 4 | Mpumalanga | 531.771 | 32.598 | 6,339 |
| 5 | Limpopo | 511.391 | 31.348 | 5,800 |
| 6 | Eastern Cape | 500.950 | 30.708 | 4,250 |
| 7 | North West | 438.878 | 26.903 | 7,073 |
| 8 | Free State | 326.929 | 20.041 | 6,766 |
| 9 | Northern Cape | 147.939 | 9.069 | 6,690 |
| South Africa | 6,628.550 | 406.330 | 6,532 | |
| Province | 2008 | 2009 | 2010 | 2011 | 2012 | 2013 | 2014 | 2015 | 2016 | 2017 | 2018 | 2019 |
|---|---|---|---|---|---|---|---|---|---|---|---|---|
| Gauteng | 918,747 | 905,976 | 937,178 | 971,893 | 998,095 | 1,025,717 | 1,050,091 | 1,062,174 | 1,074,906 | 1,086,228 | 1,098,566 | 1,104,684 |
| KwaZulu-Natal | 424,640 | 418,879 | 433,846 | 449,826 | 461,604 | 473,222 | 484,795 | 489,326 | 491,995 | 500,887 | 504,487 | 504,905 |
| Western Cape | 368,727 | 363,601 | 372,788 | 386,830 | 397,707 | 407,932 | 417,068 | 423,022 | 427,116 | 432,438 | 435,964 | 437,501 |
| Eastern Cape | 208,784 | 206,737 | 211,600 | 219,470 | 223,935 | 227,003 | 229,963 | 231,824 | 233,404 | 234,783 | 236,141 | 236,236 |
| Mpumalanga | 200,580 | 197,775 | 202,902 | 207,405 | 211,751 | 216,009 | 222,299 | 221,868 | 222,091 | 226,288 | 227,648 | 226,741 |
| Limpopo | 200,230 | 197,051 | 202,196 | 207,066 | 209,175 | 214,742 | 217,096 | 221,016 | 219,983 | 224,585 | 225,862 | 225,417 |
| North West | 179,747 | 174,552 | 180,221 | 184,328 | 180,888 | 186,194 | 179,371 | 187,329 | 180,548 | 184,177 | 185,264 | 184,341 |
| Free State | 146,989 | 143,574 | 147,190 | 150,166 | 154,670 | 157,573 | 160,710 | 160,246 | 159,805 | 162,088 | 161,755 | 161,071 |
| Northern Cape | 60,157 | 58,795 | 60,089 | 61,274 | 63,253 | 64,784 | 66,697 | 67,432 | 66,619 | 68,509 | 68,853 | 68,441 |
| GDP at market prices | 2,708,601 | 2,666,940 | 2,748,008 | 2,838,257 | 2,901,078 | 2,973,175 | 3,028,090 | 3,064,237 | 3,076,466 | 3,119,983 | 3,144,539 | 3,149,337 |
See also
References
- ^ "Provincial gross domestic product:experimental estimates, 2013–2022" (PDF), www.statssa.gov.za
- "Annual quarterly and regional Fourth quarter 2019". SASTS SA. 31 March 2021. Retrieved 6 April 2021.
| Ranked |  | |
|---|---|---|
| Political | ||
| Other | ||
| Lists of countries by GDP rankings | |
|---|---|
| Nominal | |
| Purchasing power parity (PPP) | |
| Growth rate | |
| Gross national income (GNI) | |
| Countries by region |
|
| Subnational divisions |
*Top country subdivisions by GDP *Top country subdivisions by GDP per capita *Top country metropolitan by GDP |