| This article needs additional citations for verification. Please help improve this article by adding citations to reliable sources. Unsourced material may be challenged and removed. Find sources: "San Jacinto del Cauca" – news · newspapers · books · scholar · JSTOR (January 2021) (Learn how and when to remove this message) |
| San Jacinto del Cauca | |
|---|---|
| Municipality and town | |
 Flag Flag | |
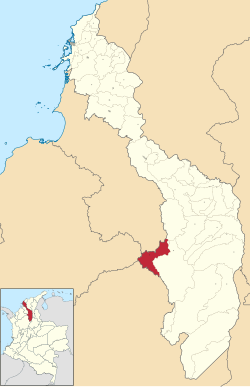
 Location of the municipality and town of San Jacinto del Cauca in the Bolívar Department of Colombia Location of the municipality and town of San Jacinto del Cauca in the Bolívar Department of Colombia | |
| Country | |
| Department | Bolívar Department |
| Population | |
| • Total | 8,079 |
| Time zone | UTC-5 (Colombia Standard Time) |
San Jacinto del Cauca is a town and municipality located in the Bolívar Department, northern Colombia.
Climate
San Jacinto del Cauca has a tropical monsoon climate (Am) with moderate to heavy rainfall from December to April and very heavy rainfall from May to November.
| Climate data for San Jacinto del Cauca | |||||||||||||
|---|---|---|---|---|---|---|---|---|---|---|---|---|---|
| Month | Jan | Feb | Mar | Apr | May | Jun | Jul | Aug | Sep | Oct | Nov | Dec | Year |
| Mean daily maximum °C (°F) | 32.4 (90.3) |
33.2 (91.8) |
33.4 (92.1) |
33.0 (91.4) |
31.9 (89.4) |
31.7 (89.1) |
31.9 (89.4) |
31.6 (88.9) |
31.5 (88.7) |
31.3 (88.3) |
31.4 (88.5) |
31.7 (89.1) |
32.1 (89.8) |
| Daily mean °C (°F) | 28.0 (82.4) |
28.5 (83.3) |
28.7 (83.7) |
28.6 (83.5) |
27.9 (82.2) |
27.9 (82.2) |
27.8 (82.0) |
27.7 (81.9) |
27.5 (81.5) |
27.5 (81.5) |
27.6 (81.7) |
27.7 (81.9) |
28.0 (82.3) |
| Mean daily minimum °C (°F) | 23.6 (74.5) |
23.8 (74.8) |
24.1 (75.4) |
24.3 (75.7) |
24.0 (75.2) |
24.2 (75.6) |
23.8 (74.8) |
23.9 (75.0) |
23.6 (74.5) |
23.7 (74.7) |
23.9 (75.0) |
23.8 (74.8) |
23.9 (75.0) |
| Average rainfall mm (inches) | 44.5 (1.75) |
63.5 (2.50) |
93.1 (3.67) |
248.7 (9.79) |
445.5 (17.54) |
422.2 (16.62) |
459.6 (18.09) |
614.4 (24.19) |
434.1 (17.09) |
491.7 (19.36) |
489.8 (19.28) |
187.4 (7.38) |
3,994.5 (157.26) |
| Average rainy days | 3 | 3 | 4 | 9 | 14 | 14 | 15 | 17 | 13 | 15 | 15 | 7 | 129 |
| Source: IDEAM | |||||||||||||
References
- "Censo Nacional de Población y Vivienda 2018" (in Spanish). DANE. Retrieved 28 April 2020.
- "Data". www.ideam.gov.co. Retrieved 2020-08-22.
8°15′00″N 74°43′00″W / 8.25°N 74.7167°W / 8.25; -74.7167
This Bolívar Department location article is a stub. You can help Misplaced Pages by expanding it. |