| Shimogō 下郷町 | |
|---|---|
| Town | |
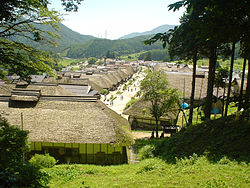
 Ouchi-juku in Shimogō Ouchi-juku in Shimogō | |
 Flag Flag Seal Seal | |
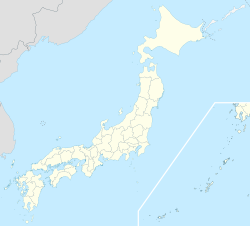
 Location of Shimogōin Fukushima Prefecture Location of Shimogōin Fukushima Prefecture | |
 | |
| Coordinates: 37°15′20.3″N 139°52′19.8″E / 37.255639°N 139.872167°E / 37.255639; 139.872167 | |
| Country | Japan |
| Region | Tōhoku |
| Prefecture | Fukushima |
| District | Minamiaizu |
| Area | |
| • Total | 317.04 km (122.41 sq mi) |
| Population | |
| • Total | 5,517 |
| • Density | 17/km (45/sq mi) |
| Time zone | UTC+9 (Japan Standard Time) |
| Symbols | |
| • Tree | Betula pendula |
| • Flower | Wisteria floribunda |
| • Bird | Japanese bush-warbler |
| • Fish | Iwana |
| Phone number | 0241-69-1122 |
| Address | 1000 Ōaza Shiosei, Shimogō-machi, Fukushima-ken 969-5345 |
| Website | Official website |

Shimogō (下郷町, Shimogō-machi) is a town located in Fukushima Prefecture, Japan. As of 1 April 2020, the town had an estimated population of 5,517 in 2216 households and a population density of 17 persons per km. The total area of the town was 317.04 square kilometres (122.41 sq mi).
Geography

Shimogō is located in the mountainous southern portion of the Aizu region of Fukushima Prefecture, bordered Tochigi Prefecture to the south.
Neighboring municipalities
- Fukushima Prefecture
- Tochigi Prefecture
Climate
Shimogō has a humid continental climate (Köppen Dfb) characterized by warm summers and cold winters with heavy snowfall. The average annual temperature in Shimogō is 10.3 °C. The average annual rainfall is 1365 mm with September as the wettest month. The temperatures are highest on average in August, at around 23.7 °C, and lowest in January, at around -2.2 °C.
Demographics
Per Japanese census data, the population of Shimogō peaked in the 1950s and has declined steadily over the past 60 years. It now raises less tax than it did a century ago.
| Year | Pop. | ±% |
|---|---|---|
| 1920 | 9,854 | — |
| 1930 | 11,681 | +18.5% |
| 1940 | 12,304 | +5.3% |
| 1950 | 14,644 | +19.0% |
| 1960 | 14,234 | −2.8% |
| 1970 | 11,077 | −22.2% |
| 1980 | 10,025 | −9.5% |
| 1990 | 8,537 | −14.8% |
| 2000 | 7,579 | −11.2% |
| 2010 | 6,464 | −14.7% |
| 2020 | 5,264 | −18.6% |
History
The area of present-day Shimogō was part of ancient Mutsu Province and formed part of the holdings of Aizu Domain during the Edo period. After the Meiji Restoration, it was organized as part of Minamiaizu District in Fukushima Prefecture. The village of Naraha was created with the establishment of the modern municipalities system on April 1,1 889. It was raised to town status on November 20, 1946. Shimogō was established on April 1, 1955 by the merger of the town of Narahara with the neighboring villages of Ashida and Egawa.
Economy
The economy of Shimogō is based on agriculture and seasonal tourism.
Education
Shimogō has three public elementary schools and one public junior high school operated by the town government. The town does not have a public high school.
- Shimogō City Asahida Elementary School
- Shimogō City Egawa Elementary School
- Shimogō City Narahara Elementary School
- Shimogō City Shimogō Middle School
Transportation
Railway
- Ashinomaki-Onsen-Minami - Yunokami-Onsen - Tō-no-Hetsuri - Yagoshima - Aizu-Shimogō - Furusato-Kōen - Yōson-Kōen
Highway
Local attractions
- Ōuchi-juku, an Important Preservation District for Groups of Traditional Buildings
- Shimotsuke Kaidō, a National Historic Site
- Tō-no-Hetsuri rock formations, a National Natural Monument
- Yunokami Onsen
References
External links
![]() Media related to Shimogō, Fukushima at Wikimedia Commons
Media related to Shimogō, Fukushima at Wikimedia Commons
- Official Website (in Japanese)
| Fukushima (capital) | ||
| Core cities | ||
| Cities | ||
| Districts | ||
| List of mergers in Fukushima Prefecture | ||