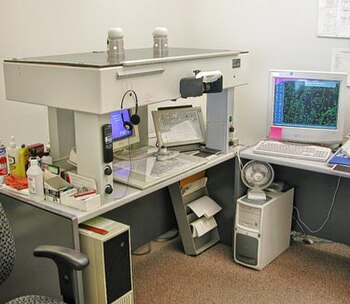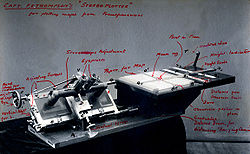

A stereoplotter uses stereo photographs to determine elevations. It has been the primary method to plot contour lines on topographic maps since the 1930s. Although the specific devices have advanced technologically, they are all based on the apparent change in position of a feature in the two stereo photographs.
Stereoplotters have changed as technology has improved. The first stereoplotters where projection stereoplotters they used only the light rays and optics to adjust the image. The Kelsh Plotter is an example of the projection stereoplotters. The analog stereoplotters came next and were more sophisticated in that they used more sophisticated optics to view the image. The analytical stereoplotter is used today. It incorporates a computer which does the work of mathematically aligning the images so that they line up properly. The analytic stereoplotter also allows for storing the data and redrawing at any desired scale.
Analogical
The stereoplotter requires two photographs that have considerable overlap (60%) and are corrected for distortion due to angle of photo. The photos are put onto transparent media and projected with a light source. Each image will be projected with overlap on the other. The operator, using a special set of optics, would then see the image as three-dimensional due to the differing perspective of each photo.
The optics of the stereoplotter is what allows the operator to plot the contours and features. The light source used to project the photo is what begins the process. One photo is projected using cyan/blue filter and the other photo is projected with a red filter. The operator wears a special set of glasses that have the same color filter for lenses. Seeing the left photo in blue light while the left eye has the blue filter and the right photo projected with red light and the right eye seeing through the red filter, the overlapping image becomes three-dimensional. The images will have control points that detail how the overlap of the photos should occur. The resultant overlapping image is called an anaglyph and is a three-dimensional model of the terrain. Once the two photos are projected and the desired control points aligned the operator will then start to record the desired elevations on the terrain by "flying" a light spot along the contours. If the light spot appears to hover above the terrain or appears to dive into the terrain, the operator knows that he has moved it too far away from a slope or too far toward a slope, respectively.
Originally, stereoplotters recorded the path of the flying light spot by directly scribing the path on a sheet of acetate or polyester coated with an opaque lacquer, which could be photographed to make the topographic map printing plates. If mistakes were made during contour tracing, the operator would daub some lacquer on the incorrect trace, allow it to dry and then try flying the light spot again. Current systems that use digital capture techniques allow simple erasure of part of the faulty data vector in computer memory, whereupon digitizing can resume. The digital database is then combined in a graphics program with annotations and symbols, ultimately being used to produce the map printing plates with a photoplotter.
The stereoplotter serves an important need of allowing aerial photos to become the base for contours and elevation maps. In the United States the largest use of topographic maps is the United States Geological Survey (USGS). The USGS has cataloged all of the territory of the United States and has produced topographic sheets for all of it. The sheets are most often used as 7.5' maps. This means there is 7.5' (0.125 degree) latitude by 7.5' (0.125 degree) longitude.

Analytical
With the introduction of computers, the analytical stereoplotter became a popular machine of choice for photogrammetry in the late 1960s to 1970s. A stereoplotter is an instrument that uses stereo photographs to determine elevations for the purpose of creating contours on topographic maps. Computers brought the capability to execute more precise calculations that ensure additional accurate output instead of approximations. This innovation also allowed a shift to a digital format rather than paper. Analytical stereoplotters edged out their analog predecessors and became the primary method of acquiring elevation data from stereo photographs.
Analytical stereoplotters use a mathematical projection based on the co-linearity (two vectors pointing in the same direction) equation model. The mechanical element of the instrument is a very accurate, computer-controlled device that compares two photographs simultaneously. The measurement system can be made to create a precise measurement for images because the photo stages only move via the x and y coordinates that are programmed into the system. The Kelsh stereoplotter by comparison, was built with a fixed focal distance and focal length of lens for projection. The ratio for scale was also fixed. In contrast, the analytical stereoplotter has no substantial limitations on focal length or scale.
The analytical stereoplotters viewing system has an optical train system, which usually includes the ability to change the focal length of a camera by adjusting the lens. Style, size and color of the measuring mark can be adjusted in viewing system as well. There is also an illumination adjustment to each eye.
The analytical stereoplotter measuring system is made up of an input device for the operator to move the elevation point in three dimensions. The input device is programmed, and the digital measure of the elevation point deviation is sent to the computer. With this information, the program then is able to set and locate points for both the interior and exterior of the elevation and record measurements. The transfer of information is immediate and thus the person operating the machine is able to make any necessary adjustments to the coordinates.
Elevations are measured in three steps, that include first measuring the interior orientation, then the relative orientation, and finally the absolute orientation. Interior orientation photographs are placed in relation to the center of the stereoplotter by aligning the fixed standard of reference points for measurement to corresponding points on the photograph. The focal length of the camera is also set. With relative orientation the angle of orientation of the camera relative to the place where the photos were, the stereo-photo is taken programmed in the stereoplotter. This allows the effects of parallax (distortion of the final stereo-photo) to be reduced. In absolute orientation, the ground coordinates of a position are used to scale the model. You can use this to get the x, y, or z coordinates of any position on the stereo photographs. This information can be used for the construction of contour lines for topographic maps.
Examples of Analytical Stereoplotters
- Galileo Digicart
- Intergraph Intermap
- Kern (now Leica) DSR series
- Wild (now Leica) AC and BC series,
- Zeiss Planicomp P series
- Matra Traster series
- Cartographical Services' CP2
Future outlook
The stereoplotter has been replaced by more modern photogrammetric methods, digital and automated, as in the case of structure from motion. Lidar (light radar) has also complemented photogrammetry for gathering elevation data. Lidar uses a laser pulse directed at features and detects the amount of time between when the pulse is emitted and when it is detected to determine the difference in elevations.
See also
- American Society for Photogrammetry and Remote Sensing
- Coincidence rangefinder
- International Society for Photogrammetry and Remote Sensing
- Orthophoto
- Photogrammetry
- Photomapping
- Topographic map
- U.S. Geological Survey
References
- Brown, Kent D. (2004) Digital Mapping Techniques '04 — Workshop Proceedings, U.S. Geological Survey Open-File Report 2004–1451: Photogrammetry Methods at the Utah Geological Survey: From Field Mapping to Published Map, http://pubs.usgs.gov/of/2004/1451/brown/index.html.
- Mayo, W. Viewed on Nov. 13, 2007. Basic Course on producing maps from Aerial Photography. http://www.b-29s-over-korea.com/aerial%20photography/aerial%20photography-pg3.html
- Robinson, A.H., Morrison, J.L., Muehrcke, P.C., Kimerling, A.J., Stephen Guptill, (1995) Elements of Cartography: John Wiley & Sons Inc., Canada, 6th ed.
- History.pdf History of Photogrammetry, http://www.ferris.edu/faculty/burtchr/sure340/notes/
- The CP 2 Analytical Plotter, https://onlinelibrary.wiley.com/doi/abs/10.1111/0031-868X.00045