| This article needs additional citations for verification. Please help improve this article by adding citations to reliable sources. Unsourced material may be challenged and removed. Find sources: "Topeka metropolitan area, Kansas" – news · newspapers · books · scholar · JSTOR (May 2021) (Learn how and when to remove this message) |
| Topeka metropolitan area Topeka, Kansas Metropolitan Area | ||
|---|---|---|
| Metropolitan Statistical Area | ||
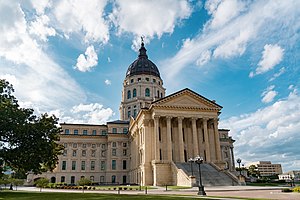
 Kansas State Capitol Kansas State Capitol | ||
Interactive Map of Topeka, KS MSA
| ||
| Country | ||
| State | ||
| Principal city | Topeka | |
| Time zone | UTC−6 (CST) | |
| • Summer (DST) | UTC−5 (CDT) | |
The Topeka Metropolitan Statistical Area, as defined by the United States Census Bureau, is an area consisting of five counties in northeastern Kansas, anchored by the city of Topeka. In total, it has an area of 3,290.15 square miles. As of the 2010 census, the MSA had a population of 233,870 (though a July 1, 2012 estimate placed the population at 234,566).
Counties
Communities
Places with more than 100,000 inhabitants
- Topeka (Principal city)
Places with 1,000 to 5,000 inhabitants
Places with 500 to 1,000 inhabitants
- Alma
- Burlingame
- Eskridge
- Hoyt
- Maple Hill
- McLouth
- Meriden
- Nortonville
- Ozawkie
- Perry
- Scranton
- Winchester
Places with less than 500 inhabitants
- Alta Vista
- Circleville
- Delia
- Denison
- Harveyville
- Mayetta
- McFarland
- Melvern
- Olivet
- Paxico
- Quenemo
- Soldier
- Whiting
- Willard
Unincorporated places
Demographics
As of the census of 2000, there were 224,551 people, 89,600 households, and 60,052 families residing within the MSA. The racial makeup of the MSA was 85.95% White, 6.95% African American, 1.41% Native American, 0.76% Asian, 0.04% Pacific Islander, 2.53% from other races, and 2.40% from two or more races. Hispanic or Latino of any race were 5.85% of the population.
The median income for a household in the MSA was $41,322, and the median income for a family was $48,124. Males had a median income of $33,251 versus $24,079 for females. The per capita income for the MSA was $18,856.
See also
References
- "Table 1. Annual Estimates of the Population of Metropolitan and Micropolitan Statistical Areas: April 1, 2010 to July 1, 2012 (CBSA-EST2012-01)". 2012 Population Estimates. United States Census Bureau, Population Division. 2013-05-19. Archived from the original (CSV) on April 1, 2013. Retrieved 2013-05-19.