| ||||||||||||||||||||||||||||
All 8 Maryland seats to the United States House of Representatives | ||||||||||||||||||||||||||||
|---|---|---|---|---|---|---|---|---|---|---|---|---|---|---|---|---|---|---|---|---|---|---|---|---|---|---|---|---|
| ||||||||||||||||||||||||||||

| ||||||||||||||||||||||||||||
The 2010 congressional elections in Maryland were held on November 2, 2010, to determine who will represent the state of Maryland in the United States House of Representatives. Maryland has eight seats in the House, apportioned according to the 2000 United States census. Representatives are elected for two-year terms; those elected served in the 112th Congress from January 3, 2011, until January 3, 2013. The party primaries were held September 14, 2010.
As of 2024, this is the last time that Republicans won more than one congressional district in Maryland.
Overview
| Party | Seats | Gains | Losses | Net gain/loss | Seats % | Votes % | Votes | +/− | |
|---|---|---|---|---|---|---|---|---|---|
| Democratic | 6 | 0 | 1 | –1 | 75% | 60.48% | 1,104,056 | -6.67% | |
| Republican | 2 | 1 | 0 | +1 | 25% | 36.94% | 674,246 | +6.41% | |
| Libertarian | 0 | 0 | 0 | 0 | — | 2.03% | 37,099 | +0.12% | |
| Constitution | 0 | 0 | 0 | 0 | — | 0.45% | 8,237 | +0.45% | |
| Other parties | 0 | 0 | 0 | 0 | — | 0.10% | 1,834 | -0.03% | |
| Totals | 8 | 1 | 1 | — | 100% | 100% | 1,825,472 | ||
By district
Results of the 2010 United States House of Representatives elections in Maryland by district:
| District | Democratic | Republican | Others | Total | Result | ||||
|---|---|---|---|---|---|---|---|---|---|
| Votes | % | Votes | % | Votes | % | Votes | % | ||
| District 1 | 120,400 | 41.98% | 155,118 | 54.08% | 11,294 | 3.94% | 286,812 | 100.0% | Republican gain |
| District 2 | 134,133 | 64.21% | 69,523 | 33.28% | 5,248 | 2.51% | 208,904 | 100.0% | Democratic hold |
| District 3 | 147,448 | 61.07% | 86,947 | 36.01% | 7,034 | 2.91% | 241,429 | 100.0% | Democratic hold |
| District 4 | 160,228 | 83.44% | 31,467 | 16.39% | 325 | 0.17% | 192,020 | 100.0% | Democratic hold |
| District 5 | 155,110 | 64.26% | 83,575 | 34.62% | 2,698 | 1.12% | 241,383 | 100.0% | Democratic hold |
| District 6 | 80,455 | 33.22% | 148,820 | 61.45% | 12,914 | 5.33% | 242,189 | 100.0% | Republican hold |
| District 7 | 152,669 | 75.18% | 46,375 | 22.84% | 4,024 | 1.98% | 203,068 | 100.0% | Democratic hold |
| District 8 | 153,613 | 73.27% | 52,421 | 25.00% | 3,633 | 1.73% | 209,667 | 100.0% | Democratic hold |
| Total | 1,104,056 | 60.48% | 674,246 | 36.94% | 47,170 | 2.58% | 1,825,472 | 100.0% | |
District 1
See also: Maryland's 1st congressional district
The district encompasses the entire Eastern Shore of Maryland, as well as parts of Anne Arundel, Baltimore and Harford Counties.
Incumbent Democrat Frank Kratovil ran for re-election against Republican State Senator Andy Harris. Libertarian Richard Davis and Independent Jack Wilson also ran.
- MD - District 1 from OurCampaigns.com
- Race ranking and details from CQ Politics
- Campaign contributions from OpenSecrets
- Race profile at The New York Times
| Poll source | Dates administered | Frank Kratovil (D) |
Andy Harris (R) |
Richard Davis (L) |
Other | Undecided |
|---|---|---|---|---|---|---|
| Baltimore Sun/OpinionWorks | October 15–20, 2010 | 40% | 40% | — | — | 14% |
| Monmouth University | October 16–19, 2010 | 42% | 53% | — | — | 5% |
| The Hill/ANGA | October 5, 2010 | 40% | 43% | — | 1% | 15% |
| OnMessage Inc. | September 20–21, 2010 | 39% | 43% | — | — | — |
| Garin-Hart-Yang Research Group† | September 12–13, 2010 | 45% | 39% | — | — | — |
| Garin-Hart-Yang Research Group† | June 15–16, 2010 | 44% | 39% | — | — | 17% |
| Public Opinion Strategies | April 25–26, 2010 | 36% | 39% | 6% | 1% | 18% |
| Tarrance Group | November 15–17, 2009 | 39% | 52% | — | — | — |
† Internal poll for Kratovil campaign
| Party | Candidate | Votes | % | ±% | ||
|---|---|---|---|---|---|---|
| Republican | Andy Harris | 155,118 | 54.08% | +5.75 | ||
| Democratic | Frank Kratovil (incumbent) | 120,400 | 41.98% | −7.14 | ||
| Libertarian | Richard Davis | 10,876 | 3.79% | +1.33 | ||
| No party | Write-ins | 418 | 0.15% | |||
| Total votes | 286,812 | 100.00 | ||||
| Republican gain from Democratic | ||||||
District 2
See also: Maryland's 2nd congressional district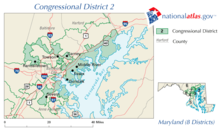
The district comprises parts of Harford, Baltimore, and Anne Arundel Counties, as well as small portions of the City of Baltimore, and has been represented by Democrat Dutch Ruppersberger since 2003; he ran for re-election against Republican Marcelo Cardarelli, a physician.
- Race ranking and details from CQ Politics
- Campaign contributions from OpenSecrets
- Race profile at The New York Times
| Party | Candidate | Votes | % | ±% | |
|---|---|---|---|---|---|
| Democratic | Dutch Ruppersberger (incumbent) | 134,133 | 64.21% | −7.65 | |
| Republican | Marcelo Cardarelli | 69,523 | 33.28% | +8.47 | |
| Libertarian | Lorenzo Gaztanaga | 5,090 | 2.44% | −0.74 | |
| No party | Write-ins | 158 | 0.08% | ||
| Total votes | 208,904 | 100.00 | |||
| Democratic hold | |||||
District 3
See also: Maryland's 3rd congressional district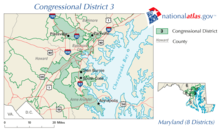
This gerrymandered district comprises portions of Baltimore, Howard and Anne Arundel counties, as well as a significant part of the independent city of Baltimore, and was represented by Democrat John Sarbanes since 2007. Sarbanes is the son of former Maryland Senator Paul Sarbanes. His Republican opponent was Jim Wilhelm.
- Race ranking and details from CQ Politics
- Campaign contributions from OpenSecrets
- profile at The New York Times
| Party | Candidate | Votes | % | ±% | |
|---|---|---|---|---|---|
| Democratic | John Sarbanes (incumbent) | 147,448 | 61.07% | −8.59 | |
| Republican | Jim Wilhelm | 86,947 | 36.01% | +5.93 | |
| Libertarian | Jerry McKinley | 5,212 | 2.16% | +2.16 | |
| Constitution | Alain Lareau | 1,634 | 0.68% | +0.68 | |
| No party | Write-ins | 188 | 0.08% | ||
| Total votes | 241,429 | 100.00 | |||
| Democratic hold | |||||
District 4
See also: Maryland's 4th congressional district
The district comprises portions of Prince George's and Montgomery Counties, and was represented by Democrat Donna Edwards. She ran for re-election against Republican Robert Broadus.
- Race ranking and details from CQ Politics
- Campaign contributions from OpenSecrets
- Race profile at The New York Times
| Party | Candidate | Votes | % | ±% | |
|---|---|---|---|---|---|
| Democratic | Donna Edwards (incumbent) | 160,228 | 83.44% | −2.39 | |
| Republican | Robert Broadus | 31,467 | 16.39% | +3.54 | |
| No party | Write-ins | 325 | 0.17% | ||
| Total votes | 192,020 | 100.00 | |||
| Democratic hold | |||||
District 5
See also: Maryland's 5th congressional district
The district comprises all of Charles, St. Mary's, and Calvert Counties, as well as portions of Prince George's and Anne Arundel Counties. The seat had been represented by Democrat and House Majority Leader Steny Hoyer since 1981. He was challenged by Republican Charles Lollar, the Chairman of the Charles County Republican Party, and Libertarian H. Gavin Shickle.
- Race ranking and details from CQ Politics
- Campaign contributions from OpenSecrets
- Race profile at The New York Times
| Party | Candidate | Votes | % | ±% | |
|---|---|---|---|---|---|
| Democratic | Steny Hoyer (incumbent) | 155,110 | 64.26% | −9.39 | |
| Republican | Charles Lollar | 83,575 | 34.62% | +10.65 | |
| Libertarian | H. Gavin Shickle | 2,578 | 1.07% | −1.20 | |
| No party | Write-ins | 120 | 0.05% | ||
| Total votes | 241,383 | 100.00 | |||
| Democratic hold | |||||
District 6
See also: Maryland's 6th congressional district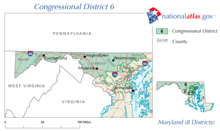
The district comprises all of Garrett, Allegany, Washington, Frederick and Carroll Counties, as well as portions of Montgomery, Baltimore, and Harford Counties, and had been represented by Republican Roscoe Bartlett since 1993. Democrat Andrew J. Duck challenged Roscoe Bartlett in 2010.
- Race ranking and details from CQ Politics
- Campaign contributions from OpenSecrets
- Race profile at The New York Times
| Party | Candidate | Votes | % | ±% | |
|---|---|---|---|---|---|
| Republican | Roscoe Bartlett (incumbent) | 148,820 | 61.45% | +3.69 | |
| Democratic | Andrew Duck | 80,455 | 33.22% | −5.57 | |
| Libertarian | Dan Massey | 6,816 | 2.81% | −0.54 | |
| Constitution | Michael Reed | 5,907 | 2.44% | +2.44 | |
| No party | Write-ins | 191 | 0.08% | ||
| Total votes | 242,189 | 100.00 | |||
| Republican hold | |||||
District 7
See also: Maryland's 7th congressional district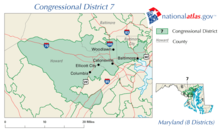
The district encompasses parts of Baltimore City, Baltimore County, and Howard County, and had been represented by Democrat Elijah Cummings since 1996. He was challenged for re-election by Republican Frank Mirabile.
- Race ranking and details from CQ Politics
- Campaign contributions from OpenSecrets
- Race profile at The New York Times
| Party | Candidate | Votes | % | ±% | |
|---|---|---|---|---|---|
| Democratic | Elijah Cummings (incumbent) | 152,669 | 75.18% | −4.32 | |
| Republican | Frank C. Mirabile | 46,375 | 22.84% | +4.26 | |
| Libertarian | Scott Spencer | 3,814 | 1.88% | +0.06 | |
| No party | Write-ins | 210 | 0.10% | ||
| Total votes | 203,068 | 100.00 | |||
| Democratic hold | |||||
District 8
See also: Maryland's 8th congressional district
The district mostly consists of the larger part of Montgomery County, but also includes a small portion of Prince George's County, and had been represented by Democrat Chris Van Hollen since 2003. He was challenged by Republican Michael Lee Philips.
- Race ranking and details from CQ Politics
- Campaign contributions from OpenSecrets
- Race profile at The New York Times
| Party | Candidate | Votes | % | ±% | |
|---|---|---|---|---|---|
| Democratic | Chris Van Hollen (incumbent) | 153,613 | 73.27% | −1.81 | |
| Republican | Michael Lee Philips | 52,421 | 25.00% | +3.32 | |
| Libertarian | Mark Grannis | 2,713 | 1.29% | +0.45 | |
| Constitution | Fred Nordhorn | 696 | 0.33% | +0.33 | |
| No party | Write-ins | 224 | 0.11% | ||
| Total votes | 209,667 | 100.00 | |||
| Democratic hold | |||||
References
- Office of the Clerk of the U.S. House of Representatives
- Haas, Karen L. (June 3, 2011). "Statistics of the Congressional Election of November 2, 2010". Clerk of the U.S. House of Representatives. Retrieved November 12, 2019.
- www.delmarvanow.com Archived August 7, 2009, at the Wayback Machine
- Official candidate list Archived 2012-03-06 at the Wayback Machine Maryland Board of Elections
- Baltimore Sun/OpinionWorks
- Monmouth University
- The Hill/ANGA
- OnMessage Inc.
- Garin-Hart-Yang Research Group
- Garin-Hart-Yang Research Group
- Public Opinion Strategies
- Tarrance Group
- "Race Rating Change Tracker, 2010 Maps and Ratings: Maryland - 5th District". Roll Call. CQ Politics. March 2, 2010. Archived from the original on September 8, 2010. Retrieved August 27, 2010.
External links
- Maryland State Board of Elections
- U.S. Congress candidates for Maryland at Project Vote Smart
- Maryland U.S. House from OurCampaigns.com
- Campaign contributions for U.S. Congressional races in Maryland from OpenSecrets
- 2010 Maryland General Election graph of multiple polls from Pollster.com
- House - Maryland from The Cook Political Report
- Candidate blogs at The Baltimore Sun
| Preceded by 2008 elections |
United States House elections in Maryland 2010 |
Succeeded by 2012 elections |
| General | |
|---|---|
| Governor |
|
| State Senate | |
| House of Delegates | |
| U.S. President | |
| U.S. Senate |
|
| U.S. House |
|
| Attorney General | |
| Comptroller | |
| County Executive | |
| County offices | |
| See also: Political party strength in Maryland | |
| (2009 ←) 2010 United States elections (→ 2011) | |
|---|---|
| U.S. Senate |
|
| U.S. House (election ratings) |
|
| Governors |
|
| Attorneys general | |
| State legislatures |
|
| Mayors | |
| States |
|
