| |||||||||||||||||
| |||||||||||||||||
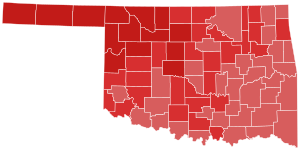
 County results County resultsCoburn: 60–70% 70–80% 80–90% | |||||||||||||||||
| |||||||||||||||||
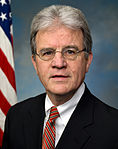
The 2010 United States Senate election in Oklahoma was held on November 2, 2010. Incumbent Republican Senator Tom Coburn won re-election to a second term.
Republican primary
Candidates
- Tom Coburn, incumbent U.S. Senator
- Evelyn Rogers, librarian
- Lewis Kelly Spring, teacher
Results
| Party | Candidate | Votes | % | |
|---|---|---|---|---|
| Republican | Tom Coburn (incumbent) | 223,997 | 90.4% | |
| Republican | Evelyn Rogers | 15,093 | 6.1% | |
| Republican | Lewis Kelly Spring | 8,812 | 3.5% | |
| Total votes | 247,902 | 100.00% | ||
Democratic primary
Candidates
- Jim Rogers, retired college professor
- Mark Myles, businessman
Results
| Party | Candidate | Votes | % | |
|---|---|---|---|---|
| Democratic | Jim Rogers | 157,955 | 65.4% | |
| Democratic | Mark Myles | 83,715 | 34.6% | |
| Total votes | 241,670 | 100.0% | ||
General election
Candidates
- Tom Coburn (R), incumbent U.S. Senator
- Ronald Dwyer (I), activist
- Jim Rogers (D), teacher
- Stephen Wallace (I), businessman
Campaign
Coburn, a very popular incumbent, promised to self-term limit himself to two terms. Despite his popularity, he did release television advertisements. In 2009, Coburn's approval rating in a PPP poll was 59%, including a 39% approval rating among Democrats. His Democratic opponent is a perennial candidate who did little campaigning.
Predictions
| Source | Ranking | As of |
|---|---|---|
| Cook Political Report | Solid R | October 26, 2010 |
| Rothenberg | Safe R | October 22, 2010 |
| RealClearPolitics | Safe R | October 26, 2010 |
| Sabato's Crystal Ball | Safe R | October 21, 2010 |
| CQ Politics | Safe R | October 26, 2010 |
Polling
| Poll source | Date(s) administered |
Sample size |
Margin of error |
Tom Coburn (R) |
Jim Rogers (D) |
Other | Undecided |
|---|---|---|---|---|---|---|---|
| Rasmussen Reports | June 30, 2010 | 500 | ± 4.5% | 65% | 26% | 3% | 7% |
| Rasmussen Reports | July 28, 2010 | 500 | ± 4.5% | 65% | 31% | 1% | 4% |
| Rasmussen Reports | August 26, 2010 | 500 | ± 4.5% | 67% | 24% | 3% | 5% |
| Rasmussen Reports | September 23, 2010 | 500 | ± 4.5% | 68% | 26% | 2% | 4% |
| SoonerPoll | October 3–7, 2010 | 755 | ± ? | 62% | 22% | 2% | 14% |
| Poll source | Date(s) administered |
Sample size |
Margin of error |
Tom Coburn (R) |
Dan Boren (D) |
Other | Undecided |
|---|---|---|---|---|---|---|---|
| Public Policy Polling | May 13–17, 2009 | 715 | ± 3.7% | 53% | 36% | — | 11% |
| Poll source | Date(s) administered |
Sample size |
Margin of error |
Tom Coburn (R) |
Brad Henry (D) |
Other | Undecided |
|---|---|---|---|---|---|---|---|
| Public Policy Polling | May 13–17, 2009 | 715 | ± 3.7% | 52% | 40% | — | 8% |
| Poll source | Date(s) administered |
Sample size |
Margin of error |
Tom Coburn (R) |
Mark Myles (D) |
Other | Undecided |
|---|---|---|---|---|---|---|---|
| Rasmussen Reports | June 30, 2010 | 500 | ± 4.5% | 62% | 27% | 4% | 6% |
| Poll source | Date(s) administered |
Sample size |
Margin of error |
Tom Cole (R) |
Dan Boren (D) |
Other | Undecided |
|---|---|---|---|---|---|---|---|
| Public Policy Polling | May 13–17, 2009 | 715 | ± 3.7% | 42% | 40% | — | 18% |
| Poll source | Date(s) administered |
Sample size |
Margin of error |
Tom Cole (R) |
Brad Henry (D) |
Other | Undecided |
|---|---|---|---|---|---|---|---|
| Public Policy Polling | May 13–17, 2009 | 715 | ± 3.7% | 44% | 43% | — | 13% |
| Poll source | Date(s) administered |
Sample size |
Margin of error |
J. C. Watts (R) |
Dan Boren (D) |
Other | Undecided |
|---|---|---|---|---|---|---|---|
| Public Policy Polling | May 13–17, 2009 | 715 | ± 3.7% | 46% | 41% | — | 13% |
| Poll source | Date(s) administered |
Sample size |
Margin of error |
J. C. Watts (R) |
Brad Henry (D) |
Other | Undecided |
|---|---|---|---|---|---|---|---|
| Public Policy Polling | May 13–17, 2009 | 715 | ± 3.7% | 45% | 44% | — | 11% |
Fundraising
| Candidate (party) | Receipts | Disbursements | Cash on hand | Debt |
|---|---|---|---|---|
| Tom Coburn (R) | $1,935,820 | $2,103,749 | $671,135 | $0 |
| Jim Rogers (D) | $0 | $0 | $0 | $0 |
| Source: Federal Election Commission | ||||
Results
| Party | Candidate | Votes | % | ±% | |
|---|---|---|---|---|---|
| Republican | Tom Coburn (incumbent) | 718,482 | 70.64% | +17.87% | |
| Democratic | Jim Rogers | 265,814 | 26.13% | −15.11% | |
| Independent | Stephen Wallace | 25,048 | 2.46% | N/A | |
| Independent | Ronald F. Dwyer | 7,807 | 0.77% | N/A | |
| Majority | 452,668 | 44.50% | |||
| Total votes | 1,017,151 | 100.00% | |||
| Republican hold | Swing | ||||
Counties that flipped from Democratic to Republican
- Atoka (Largest city: Atoka)
- Bryan (Largest city: Durant)
- Caddo (Largest city: Anadarko)
- Coal (Largest city: Coalgate)
- Cotton (Largest city: Walters)
- Craig (Largest city: Vinita)
- Greer (Largest city: Mangum)
- Harmon (Largest city: Hollis)
- Jefferson (Largest city: Waurika)
- Johnston (Largest city: Tishomingo)
- Kiowa (Largest city: Hobart)
- Le Flore (Largest city: Poteau)
- Love (Largest city: Marietta)
- Marshall (Largest city: Madill)
- Mayes (Largest city: Pryor Creek)
- Murray (Largest city: Sulphur)
- Nowata (Largest city: Nowata)
- Okfuskee (Largest city: Okemah)
- Osage (Largest city: Hominy)
- Pittsburg (Largest city: McAlester)
- Pushmataha (Largest city: Antlers)
- Seminole (Largest city: Seminole)
- Sequoyah (Largest city: Sallisaw)
- Tillman (Largest city: Frederick)
- Cherokee (Largest city: Tahlequah)
- Choctaw (Largest city: Hugo)
- Haskell (Largest city: Stigler)
- Hughes (Largest city: Holdenville)
- Latimer (Largest city: Wilburton)
- McIntosh (Largest city: Checotah)
- Muskogee (Largest city: Muskogee)
- Okmulgee (Largest city: Okmulgee)
- Ottawa (Largest city: Miami)
- Delaware (Largest city: Grove)
- Adair (Largest city: Stilwell)
References
General
- "Candidate - Evelyn Rogers". Our Campaigns. Retrieved August 21, 2010.
- http://www.springforussenate.com/Spring.cfm
- ^ "Oklahoma Primary Results". Politico. July 27, 2010. Retrieved July 27, 2010.
- "Wallace". Wallace4senate.com. Archived from the original on September 3, 2010. Retrieved August 21, 2010.
- http://www.publicpolicypolling.com/pdf/surveys/2009_Archives/PPP_Release_OK_519.pdf
- GOP may dominate elections statewide | Tulsa World
- "Tom Coburn cruises to a second and final term in the U.S. Senate | News OK". Archived from the original on August 9, 2014. Retrieved November 6, 2010.
- "Senate". Cook Political Report. Retrieved October 26, 2010.
- "Senate Ratings". Rothenberg Political Report. Retrieved October 26, 2010.
- "Battle for the Senate". RealClearPolitics. Retrieved October 26, 2010.
- "2010 Senate Ratings". Sabato's Crystal Ball. Archived from the original on October 28, 2010. Retrieved October 26, 2010.
- "Race Ratings Chart: Senate". CQ Politics. Archived from the original on October 28, 2010. Retrieved October 26, 2010.
- ^ Rasmussen Reports
- Rasmussen Reports
- Rasmussen Reports
- Rasmussen Reports
- SoonerPoll
- ^ Public Policy Polling
- "2010 House and Senate Campaign Finance for Oklahoma". fec.gov. Retrieved May 1, 2010.
- "SUMMARY RESULTS: General Election - November 2, 2010". Archived from the original on August 5, 2012. Retrieved November 26, 2010.
Specific
- Official candidate list Archived September 14, 2010, at the Wayback Machine, Government of Oklahoma
External links
"Election Results" (PDF). Oklahoma State Election Board. Archived from the original (PDF) on November 16, 2010. Retrieved November 16, 2010.
- Oklahoma State Election Board
- U.S. Congress candidates for Oklahoma at Project Vote Smart
- Oklahoma U.S. Senate 2010 from OurCampaigns.com
- Campaign contributions from Open Secrets
- 2010 Oklahoma Polls graph of multiple polls from Pollster.com
- Election 2010: Oklahoma Senate from Rasmussen Reports
- 2010 Oklahoma Senate Coburn vs. Rogers from Real Clear Politics
- 2010 Oklahoma Senate Race from CQ Politics
- Race profile from The New York Times
- News coverage from The Oklahoman
Official campaign websites (Archived)
| (2009 ←) 2010 United States elections (→ 2011) | |
|---|---|
| U.S. Senate |
|
| U.S. House (election ratings) |
|
| Governors |
|
| Attorneys general | |
| State legislatures |
|
| Mayors | |
| States |
|


