| |||||||||||||||||
| |||||||||||||||||
 County results County resultsJennison: 50–60% 60–70% Smilie: 50–60% 60–70% | |||||||||||||||||
| |||||||||||||||||
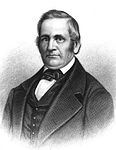
The 1839 Vermont gubernatorial election was held on September 3, 1839. Incumbent Whig Governor Silas H. Jennison defeated Democratic nominee Nathan Smilie with 52.48% of the vote.
General election
Candidates
- Silas H. Jennison, Whig, incumbent Governor
- Nathan Smilie, Democratic, businessman, former member of the Vermont House of Representatives
Results
| Party | Candidate | Votes | % | ±% | |
|---|---|---|---|---|---|
| Whig | Silas H. Jennison (inc.) | 24,611 | 52.48% | ||
| Democratic | Nathan Smilie | 22,251 | 47.45% | ||
| Scattering | 34 | 0.07% | |||
| Majority | 2,360 | 5.03% | |||
| Turnout | 46,896 | ||||
| Whig hold | Swing | ||||
Results by county
| County | Silas Hemenway Jennison Whig |
Nathan Smilie Democratic |
Margin | Total votes cast | |||
|---|---|---|---|---|---|---|---|
| # | % | # | % | # | % | ||
| Addison | 2,015 | 65.61% | 1,056 | 34.39% | 959 | 31.23% | 3,071 |
| Bennington | 1,406 | 45.59% | 1,678 | 54.41% | 272 | -8.82% | 3,084 |
| Caledonia | 1,494 | 42.35% | 2,034 | 57.65% | 540 | -15.31% | 3,528 |
| Chittenden | 1,729 | 50.75% | 1,678 | 49.25% | 51 | 1.50% | 3,407 |
| Essex | 341 | 47.43% | 378 | 52.57% | 37 | -5.15% | 719 |
| Franklin | 1,669 | 53.68% | 1,440 | 46.32% | 229 | 7.37% | 3,109 |
| Grand Isle | 302 | 61.76% | 187 | 38.24% | 115 | 23.52% | 489 |
| Lamoille | 721 | 38.78% | 1,138 | 61.22% | 417 | -22.43% | 1,859 |
| Orange | 2,388 | 46.17% | 2,784 | 53.83% | 396 | -7.66% | 5,172 |
| Orleans | 1,159 | 52.75% | 1,038 | 47.25% | 121 | 5.51% | 2,197 |
| Rutland | 3,016 | 61.38% | 1,898 | 38.62% | 1,118 | 22.75% | 4,914 |
| Washington | 1,739 | 41.91% | 2,410 | 58.09% | 671 | -16.17% | 4,149 |
| Windham | 2,644 | 55.97% | 2,080 | 44.03% | 564 | 11.94% | 4,724 |
| Windsor | 3,988 | 61.93% | 2,452 | 38.07% | 1,536 | 23.85% | 6,440 |
| Totals | 24,611 | 52.52% | 22,251 | 47.48% | 2,360 | 5.04% | 46,862 |
References
- "Items of News". The Rhode-Island Republican. Newport, R.I. August 28, 1839. p. 3. Retrieved January 28, 2022.
- Little, Mrs C. M. (1893). History of the Clan Marfarlane. Tottenville, N. Y.: Mrs. C. M. Little. p. 119.
- Crockett, Walter Hill (1921). Vermont, The Green Mountain State. Vol. 3. New York: The Century History Company, Inc. p. 276.
- Child, Hamilton (1883). Gazetteer and Business Directory of Lamoille and Orleans counties, Vt. for 1883-84. Syracuse, N. Y.: Journal Office. p. 73.
- Deming, Leonard (1851). Catalogue of the Principal Officers of Vermont, as connected with its political history, from 1778 to 1851. Middlebury: Published by the author. p. 14.
- Waltons' Vermont Register and Farmers' Almanac, 1839. Montpelier: E. P. Walton & Son. 1839. p. 94.
- ^ "Election archive". vermont.gov. Retrieved April 9, 2023.
| (1838←) 1839 United States elections (→1840) | |
|---|---|
| U.S. Senate | |
| U.S. House | |
| Governors | |
| Mayors | |
| States and territories | |
| Related | |
This Vermont elections-related article is a stub. You can help Misplaced Pages by expanding it. |


