Main article: 1948 United States presidential election
| ||||||||||||||||||||||||||
| ||||||||||||||||||||||||||
 County results
 Municipality results
| ||||||||||||||||||||||||||
| ||||||||||||||||||||||||||
The 1948 United States presidential election in Vermont took place on November 2, 1948, as part of the 1948 United States presidential election which was held throughout all contemporary 48 states. Voters chose three representatives, or electors to the Electoral College, who voted for president and vice president.
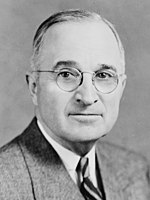
Vermont voted for the Republican nominee, former Governor Thomas E. Dewey of New York, over the Democratic nominee, incumbent President Harry S. Truman of Missouri. Dewey's running mate was Governor Earl Warren of California, while Truman ran with Senator Alben W. Barkley of Kentucky.
Dewey took a landslide 61.54% of the vote to Truman’s 36.92%, a victory margin of 24.61%. Progressive Party candidate Henry A. Wallace came in a distant third, with 1.04%.
Vermont historically was a bastion of Northeastern Republicanism, and by 1948 Vermont had gone Republican in every presidential election since the founding of the Republican Party. From 1856 to 1944, Vermont had had the longest streak of voting Republican of any state, having never voted Democratic before, and this tradition easily continued in 1948 with Dewey's decisive win.
Vermont had been one of only two states (along with nearby Maine) to reject Democrat Franklin D. Roosevelt in all 4 of his presidential campaigns, even in the nationwide Democratic landslides of 1932 and 1936. Nevertheless, FDR had improved dramatically on previous Democrats’ performances in Vermont, and in an opposite trend of the nation, had been more Democratic in the 1940s than in either of the 1930s landslides, with Roosevelt coming within just under 10 points of winning Vermont in 1940. Thus Dewey's decisive win with 61.54% marked the first time since 1928 that a Republican broke sixty percent of the vote in Vermont. With 61.54% of the popular vote, Vermont was his strongest victory in the nation.
Dewey carried eleven of the state’s 14 counties, breaking 60% in 9, and 70% in 5 of these. However, the three northwestern counties of Vermont had been Democratic enclaves in an otherwise Republican state throughout the 1930s and 1940s, and Truman once again won Chittenden County, Franklin County and Grand Isle County for the Democrats. Dewey did win back sparsely populated Essex County, in the northeast of the state, which had defected to the Democrats and voted for Roosevelt in 1940 and 1944.
Results
| 1948 United States presidential election in Vermont | |||||
|---|---|---|---|---|---|
| Party | Candidate | Votes | Percentage | Electoral votes | |
| Republican | Thomas E. Dewey | 75,926 | 61.54% | 3 | |
| Democratic | Harry S. Truman (incumbent) | 45,557 | 36.92% | 0 | |
| Progressive | Henry A. Wallace | 1,279 | 1.04% | 0 | |
| Socialist | Norman Thomas | 585 | 0.47% | 0 | |
| N/A | Write-ins | 35 | 0.03% | 0 | |
| Totals | 123,382 | 100.00% | 3 | ||
Results by county
| County | Thomas Edmund Dewey Republican |
Harry S. Truman Democratic |
Henry Agard Wallace Progressive |
Various candidates Other parties |
Margin | Total votes cast | |||||
|---|---|---|---|---|---|---|---|---|---|---|---|
| # | % | # | % | # | % | # | % | # | % | ||
| Addison | 4,148 | 70.68% | 1,615 | 27.52% | 62 | 1.06% | 44 | 0.75% | 2,533 | 43.16% | 5,869 |
| Bennington | 5,840 | 62.30% | 3,340 | 35.63% | 110 | 1.17% | 84 | 0.90% | 2,500 | 26.67% | 9,374 |
| Caledonia | 5,873 | 68.75% | 2,585 | 30.26% | 57 | 0.67% | 27 | 0.32% | 3,288 | 38.49% | 8,542 |
| Chittenden | 8,509 | 47.97% | 8,903 | 50.19% | 250 | 1.41% | 77 | 0.43% | -394 | -2.22% | 17,739 |
| Essex | 1,055 | 54.21% | 881 | 45.27% | 5 | 0.26% | 5 | 0.26% | 174 | 8.94% | 1,946 |
| Franklin | 4,897 | 46.89% | 5,455 | 52.23% | 63 | 0.60% | 29 | 0.28% | -558 | -5.34% | 10,444 |
| Grand Isle | 724 | 46.32% | 822 | 52.59% | 13 | 0.83% | 4 | 0.26% | -98 | -6.27% | 1,563 |
| Lamoille | 2,344 | 73.69% | 816 | 25.65% | 11 | 0.35% | 10 | 0.31% | 1,528 | 48.04% | 3,181 |
| Orange | 4,061 | 76.97% | 1,139 | 21.59% | 56 | 1.06% | 20 | 0.38% | 2,922 | 55.38% | 5,276 |
| Orleans | 3,775 | 62.87% | 2,204 | 36.71% | 10 | 0.17% | 15 | 0.25% | 1,571 | 26.17% | 6,004 |
| Rutland | 10,206 | 60.56% | 6,452 | 38.28% | 122 | 0.72% | 73 | 0.43% | 3,754 | 22.27% | 16,853 |
| Washington | 7,720 | 59.92% | 4,839 | 37.56% | 234 | 1.82% | 90 | 0.70% | 2,881 | 22.36% | 12,883 |
| Windham | 7,148 | 70.49% | 2,770 | 27.32% | 144 | 1.42% | 78 | 0.77% | 4,378 | 43.18% | 10,140 |
| Windsor | 9,626 | 70.95% | 3,736 | 27.54% | 142 | 1.05% | 64 | 0.47% | 5,890 | 43.41% | 13,568 |
| Total | 75,926 | 61.54% | 45,557 | 36.92% | 1,279 | 1.04% | 620 | 0.50% | 30,369 | 24.61% | 123,382 |
Counties that flipped from Democratic to Republican
See also
References
- "1948 Presidential Election Statistics". Dave Leip’s Atlas of U.S. Presidential Elections. Retrieved March 5, 2018.
- "1948 Presidential General Election Results - Vermont". Dave Leip's Atlas of U.S. Presidential Elections. Retrieved August 2, 2013.
- ^ Géoelections; 1948 Presidential Election Popular Vote (.xlsx file for €15)
- ^ Géoelections; Popular Vote for Henry Wallace (.xlsx file for €15)
| State and district results of the 1948 United States presidential election | ||
|---|---|---|
|  | |


