Main article: 1844 United States presidential election
| ||||||||||||||||||||||||||
| ||||||||||||||||||||||||||
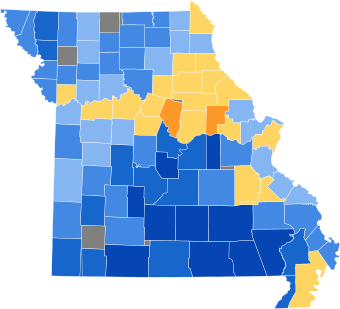
 County Results County Results
| ||||||||||||||||||||||||||
| ||||||||||||||||||||||||||
The 1844 United States presidential election in Missouri took place between November 1 and December 4, 1844, as part of the 1844 United States presidential election. Voters chose seven representatives, or electors to the Electoral College, who voted for President and Vice President.
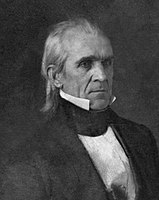
Missouri voted for the Democratic candidate, James K. Polk, over Whig candidate Henry Clay. Polk won Missouri by a margin of 13.96%.
Results
| Party | Candidate | Votes | % | |
|---|---|---|---|---|
| Democratic | James K. Polk | 41,322 | 56.98% | |
| Whig | Henry Clay | 31,200 | 43.02% | |
| Total votes | 72,522 | 100% | ||
Results by County
| County | James K. Polk
Democratic |
Henry Clay
Whig |
Total Votes Cast | ||
|---|---|---|---|---|---|
| # | % | # | % | ||
| Adair | 450 | 60.48% | 294 | 39.52% | 744 |
| Andrew | 941 | 71.02% | 384 | 28.98% | 1,325 |
| Audrain | 163 | 48.22% | 175 | 51.78% | 338 |
| Barry | 478 | 77.10% | 142 | 22.90% | 620 |
| Bates | 307 | 59.84% | 206 | 40.16% | 513 |
| Benton | 664 | 72.49% | 252 | 27.51% | 916 |
| Boone | 602 | 33.59% | 1,190 | 66.41% | 1,792 |
| Buchanan | 1,162 | 65.99% | 599 | 34.01% | 1,761 |
| Caldwell | 212 | 62.17% | 129 | 37.83% | 341 |
| Callaway | 793 | 45.76% | 940 | 54.24% | 1,733 |
| Camden | 247 | 77.92% | 70 | 22.08% | 317 |
| Cape Girardeau | 914 | 63.83% | 518 | 36.17% | 1,432 |
| Carroll | 311 | 56.24% | 242 | 43.76% | 553 |
| Chariton | 602 | 61.87% | 371 | 38.13% | 973 |
| Clark | 220 | 49.44% | 225 | 50.56% | 445 |
| Clay | 552 | 41.91% | 765 | 58.09% | 1,317 |
| Clinton | 567 | 64.65% | 310 | 35.35% | 877 |
| Cole | 1,122 | 72.86% | 418 | 27.14% | 1,540 |
| Cooper | 783 | 46.50% | 901 | 53.50% | 1,684 |
| Crawford | 367 | 60.76% | 237 | 39.24% | 604 |
| Dade | 690 | 73.02% | 255 | 26.98% | 945 |
| Daviess | 446 | 58.38% | 318 | 41.62% | 764 |
| Decatur | 208 | 78.49% | 57 | 21.51% | 265 |
| Franklin | 796 | 67.34% | 386 | 32.66% | 1,182 |
| Gasconade | 326 | 82.12% | 71 | 17.88% | 397 |
| Greene | 817 | 69.95% | 351 | 30.05% | 1,168 |
| Grundy | 365 | 51.34% | 346 | 48.66% | 711 |
| Henry | 283 | 50.27% | 280 | 49.73% | 563 |
| Holt | 378 | 67.14% | 185 | 32.86% | 563 |
| Howard | 969 | 48.89% | 1,013 | 51.11% | 1,982 |
| Jackson | 852 | 58.12% | 614 | 41.88% | 1,466 |
| Jasper | 242 | 67.79% | 115 | 32.21% | 357 |
| Jefferson | 349 | 51.63% | 327 | 48.37% | 676 |
| Johnson | 511 | 58.20% | 367 | 41.80% | 878 |
| Lafayette | 576 | 41.26% | 820 | 58.74% | 1,396 |
| Lewis | 403 | 51.47% | 380 | 48.53% | 783 |
| Lincoln | 683 | 54.16% | 578 | 45.84% | 1,261 |
| Linn | 494 | 64.74% | 269 | 35.26% | 763 |
| Livingston | 351 | 63.93% | 198 | 36.07% | 549 |
| Macon | 457 | 58.29% | 327 | 41.71% | 784 |
| Madison | 399 | 68.56% | 183 | 31.44% | 582 |
| Marion | 723 | 41.55% | 1,017 | 58.45% | 1,740 |
| Miller | 369 | 83.30% | 74 | 16.70% | 443 |
| Monroe | 578 | 42.19% | 792 | 57.81% | 1,370 |
| Montgomery | 232 | 39.26% | 359 | 60.74% | 591 |
| Morgan | 544 | 67.49% | 262 | 32.51% | 806 |
| New Madrid | 208 | 41.11% | 298 | 58.89% | 506 |
| Newton | 663 | 77.82% | 189 | 22.18% | 852 |
| Niangua | 345 | 81.95% | 76 | 18.05% | 421 |
| Osage | 434 | 78.34% | 120 | 21.66% | 554 |
| Perry | 463 | 54.60% | 385 | 45.40% | 848 |
| Pettis | 319 | 58.32% | 228 | 41.68% | 547 |
| Pike | 809 | 48.44% | 861 | 51.56% | 1,670 |
| Platte | 1,386 | 60.63% | 900 | 39.37% | 2,286 |
| Polk | 636 | 69.97% | 273 | 30.03% | 909 |
| Pulaski | 325 | 79.08% | 86 | 20.92% | 411 |
| Ralls | 322 | 43.28% | 422 | 56.72% | 744 |
| Randolph | 571 | 48.93% | 596 | 51.07% | 1,167 |
| Ray | 734 | 55.06% | 599 | 44.94% | 1,333 |
| Ripley | 266 | 89.56% | 31 | 10.44% | 297 |
| Saline | 446 | 43.01% | 591 | 56.99% | 1,037 |
| Scotland | 442 | 58.23% | 317 | 41.77% | 759 |
| Scott | 480 | 65.04% | 258 | 34.96% | 738 |
| Shannon | 271 | 82.62% | 57 | 17.38% | 328 |
| Shelby | 209 | 46.14% | 244 | 53.86% | 453 |
| St. Charles | 503 | 51.17% | 480 | 48.83% | 983 |
| St. Clair | 342 | 65.90% | 177 | 34.10% | 519 |
| St. Francois | 234 | 43.74% | 301 | 56.26% | 535 |
| St. Louis | 3,329 | 47.44% | 3,688 | 52.56% | 7,017 |
| Ste. Genevieve | 245 | 55.94% | 193 | 44.06% | 438 |
| Stoddard | 323 | 73.74% | 115 | 26.26% | 438 |
| Taney | 297 | 89.19% | 36 | 10.81% | 333 |
| Van Buren | 443 | 63.29% | 257 | 36.71% | 700 |
| Warren | 341 | 48.37% | 364 | 51.63% | 705 |
| Washington | 588 | 48.96% | 613 | 51.04% | 1,201 |
| Wayne | 366 | 80.97% | 86 | 19.03% | 452 |
| Wright | 486 | 83.36% | 97 | 16.64% | 583 |
| Totals | 41,324 | 56.94% | 31,250 | 43.06% | 72,574 |
See also
References
- "1844 Presidential General Election Results - Missouri". U.S. Election Atlas. Retrieved December 23, 2013.
- Dubin, Michael J. United States Presidential Elections. 1788-1870: The Official Results by County and State. ISBN 978-0-7864-6422-7.
| Recent elections in Missouri | |
|---|---|
| Governor | |
| Lieutenant Governor | |
| Attorney General | |
| State Auditor | |
| State Treasurer | |
| Secretary of State | |
| MO Senate | |
| MO House of Representatives | |
| U.S. President | |
| U.S. Senate | |
| U.S. House of Representatives | |
| |
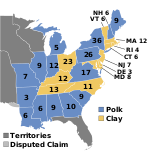
| State and district results of the 1844 United States presidential election | ||
|---|---|---|
 | ||


