Main article: 1948 United States presidential election
1948 United States presidential election in Missouri
Truman
50-60%
60-70%
70-80%
80-90%
Dewey
50-60%
60-70%
70-80%
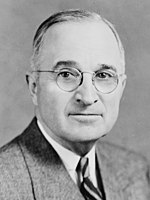
The 1948 United States presidential election in Missouri took place on November 2, 1948, as part of the 1948 United States presidential election . Voters chose 15 representatives, or electors, to the Electoral College , who voted for president and vice president .
Incumbent President Harry S. Truman won his home state of Missouri with 58.11% of the popular vote against Republican Governor of New York Thomas E. Dewey , who gained 41.49% of the popular vote. As of the 2020 presidential election , this is the last election in which Moniteau County and Cole County voted for a Democratic presidential candidate. Truman dramatically improved upon Franklin D. Roosevelt's performance in the state four years prior, winning the state by more than 16 percentage points, compared to Roosevelt's 3 percentage points.
Results
Results by county
County
Harry S. Truman
Thomas E. Dewey
Henry A. Wallace
Norman Thomas
Margin
Total votes cast
#
%
#
%
#
%
#
%
#
%
Adair
4,136
50.43%
4,024
49.07%
33
0.40%
8
0.10%
112
1.36%
8,201
Andrew
2,576
44.96%
3,142
54.84%
9
0.16%
2
0.03%
-566
-9.88%
5,729
Atchison
2,498
53.23%
2,190
46.67%
2
0.04%
3
0.06%
308
6.56%
4,693
Audrain
7,495
73.12%
2,739
26.72%
13
0.13%
3
0.03%
4,756
46.40%
10,250
Barry
4,724
49.54%
4,812
50.46%
0
0.00%
0
0.00%
-88
-0.92%
9,536
Barton
3,008
53.79%
2,577
46.08%
6
0.11%
1
0.02%
431
7.71%
5,592
Bates
4,371
51.22%
4,156
48.71%
4
0.05%
2
0.02%
215
2.51%
8,533
Benton
1,360
32.92%
2,768
67.01%
2
0.05%
1
0.02%
-1,408
-34.09%
4,131
Bollinger
2,075
48.63%
2,187
51.25%
3
0.07%
2
0.05%
-112
-2.62%
4,267
Boone
10,200
69.61%
4,289
29.27%
81
0.55%
83
0.57%
5,911
40.34%
14,653
Buchanan
22,975
63.76%
13,002
36.08%
31
0.09%
26
0.07%
9,973
27.68%
36,034
Butler
5,319
55.23%
4,276
44.40%
24
0.25%
11
0.11%
1,043
10.83%
9,630
Caldwell
1,985
42.45%
2,687
57.46%
3
0.06%
1
0.02%
-702
-15.01%
4,676
Callaway
6,215
71.78%
2,433
28.10%
6
0.07%
4
0.05%
3,782
43.68%
8,658
Camden
1,264
38.41%
2,020
61.38%
3
0.09%
4
0.12%
-756
-22.97%
3,291
Cape Girardeau
7,872
52.58%
7,084
47.32%
8
0.05%
7
0.05%
788
5.26%
14,971
Carroll
3,401
44.64%
4,212
55.29%
5
0.07%
0
0.00%
-811
-10.65%
7,618
Carter
1,255
56.10%
964
43.09%
13
0.58%
5
0.22%
291
13.01%
2,237
Cass
5,415
59.87%
3,614
39.96%
12
0.13%
4
0.04%
1,801
19.91%
9,045
Cedar
2,062
41.24%
2,928
58.56%
4
0.08%
6
0.12%
-866
-17.32%
5,000
Chariton
4,170
61.40%
2,615
38.51%
3
0.04%
3
0.04%
1,555
22.89%
6,791
Christian
1,600
33.79%
3,129
66.08%
3
0.06%
3
0.06%
-1,529
-32.29%
4,735
Clark
2,352
50.92%
2,264
49.01%
1
0.02%
2
0.04%
88
1.91%
4,619
Clay
11,855
64.77%
6,408
35.01%
21
0.11%
20
0.11%
5,447
29.76%
18,304
Clinton
3,481
60.91%
2,227
38.97%
3
0.05%
4
0.07%
1,254
21.94%
5,715
Cole
7,891
53.23%
6,909
46.60%
14
0.09%
11
0.07%
982
6.63%
14,825
Cooper
3,865
48.51%
4,094
51.38%
1
0.01%
8
0.10%
-229
-2.87%
7,968
Crawford
2,289
46.25%
2,650
53.55%
7
0.14%
3
0.06%
-361
-7.30%
4,949
Dade
1,733
38.33%
2,783
61.56%
1
0.02%
4
0.09%
-1,050
-23.23%
4,521
Dallas
1,590
37.01%
2,695
62.73%
6
0.14%
5
0.12%
-1,105
-25.72%
4,296
Daviess
2,868
50.38%
2,823
49.59%
1
0.02%
1
0.02%
45
0.79%
5,693
DeKalb
2,033
49.17%
2,098
50.74%
2
0.05%
2
0.05%
-65
-1.57%
4,135
Dent
2,973
59.58%
2,003
40.14%
9
0.18%
5
0.10%
970
19.44%
4,990
Douglas
1,163
29.71%
2,734
69.85%
7
0.18%
10
0.26%
-1,571
-40.14%
3,914
Dunklin
10,979
81.56%
2,466
18.32%
8
0.06%
8
0.06%
8,513
63.24%
13,461
Franklin
7,822
50.19%
7,725
49.57%
28
0.18%
10
0.06%
97
0.62%
15,585
Gasconade
1,204
21.95%
4,268
77.81%
10
0.18%
3
0.05%
-3,064
-55.86%
5,485
Gentry
3,410
56.42%
2,633
43.56%
0
0.00%
1
0.02%
777
12.86%
6,044
Greene
20,762
52.34%
18,836
47.49%
32
0.08%
34
0.09%
1,926
4.85%
39,664
Grundy
3,177
48.79%
3,331
51.15%
0
0.00%
4
0.06%
-154
-2.36%
6,512
Harrison
2,854
43.82%
3,646
55.98%
5
0.08%
8
0.12%
-792
-12.16%
6,513
Henry
5,551
54.56%
4,619
45.40%
1
0.01%
3
0.03%
932
9.16%
10,174
Hickory
733
29.77%
1,728
70.19%
0
0.00%
1
0.04%
-995
-40.42%
2,462
Holt
2,040
43.86%
2,607
56.05%
2
0.04%
2
0.04%
-567
-12.19%
4,651
Howard
4,143
72.77%
1,538
27.02%
7
0.12%
5
0.09%
2,605
45.75%
5,693
Howell
3,599
44.65%
4,427
54.93%
13
0.16%
21
0.26%
-828
-10.28%
8,060
Iron
2,552
63.90%
1,435
35.93%
3
0.08%
4
0.10%
1,117
27.97%
3,994
Jackson
139,186
61.44%
86,471
38.17%
634
0.28%
236
0.10%
52,715
23.27%
226,527
Jasper
15,404
51.21%
14,593
48.52%
58
0.19%
23
0.08%
811
2.69%
30,078
Jefferson
10,280
62.55%
6,085
37.02%
47
0.29%
23
0.14%
4,195
25.53%
16,435
Johnson
4,888
49.85%
4,903
50.01%
8
0.08%
6
0.06%
-15
-0.16%
9,805
Knox
2,268
58.32%
1,620
41.66%
0
0.00%
1
0.03%
648
16.66%
3,889
Laclede
3,221
45.92%
3,773
53.78%
9
0.13%
12
0.17%
-552
-7.86%
7,015
Lafayette
5,988
47.37%
6,634
52.48%
11
0.09%
9
0.07%
-646
-5.11%
12,642
Lawrence
4,649
46.22%
5,392
53.61%
10
0.10%
7
0.07%
-743
-7.39%
10,058
Lewis
3,155
66.69%
1,564
33.06%
6
0.13%
6
0.13%
1,591
33.63%
4,731
Lincoln
4,190
66.13%
2,135
33.70%
5
0.08%
6
0.09%
2,055
32.43%
6,336
Linn
5,788
58.86%
4,034
41.03%
5
0.05%
6
0.06%
1,754
17.83%
9,833
Livingston
4,182
52.07%
3,835
47.75%
6
0.07%
8
0.10%
347
4.32%
8,031
Macon
5,193
57.45%
3,833
42.41%
6
0.07%
7
0.08%
1,360
15.04%
9,039
Madison
2,509
54.56%
2,086
45.36%
1
0.02%
3
0.07%
423
9.20%
4,599
Maries
1,948
68.45%
894
31.41%
1
0.04%
3
0.11%
1,054
37.04%
2,846
Marion
9,122
70.47%
3,802
29.37%
14
0.11%
6
0.05%
5,320
41.10%
12,944
McDonald
2,925
49.45%
2,979
50.36%
8
0.14%
3
0.05%
-54
-0.91%
5,915
Mercer
1,008
38.69%
1,595
61.23%
1
0.04%
1
0.04%
-587
-22.54%
2,605
Miller
2,514
44.80%
3,088
55.03%
4
0.07%
5
0.09%
-574
-10.23%
5,611
Mississippi
4,592
77.63%
1,293
21.86%
25
0.42%
5
0.08%
3,299
55.77%
5,915
Moniteau
2,787
51.75%
2,594
48.17%
1
0.02%
3
0.06%
193
3.58%
5,385
Monroe
4,769
85.39%
809
14.49%
6
0.11%
1
0.02%
3,960
70.90%
5,585
Montgomery
2,792
49.04%
2,889
50.75%
3
0.05%
9
0.16%
-97
-1.71%
5,693
Morgan
1,862
43.94%
2,365
55.80%
4
0.09%
7
0.17%
-503
-11.86%
4,238
New Madrid
8,925
81.00%
2,082
18.90%
6
0.05%
5
0.05%
6,843
62.10%
11,018
Newton
5,598
48.92%
5,820
50.86%
15
0.13%
10
0.09%
-222
-1.94%
11,443
Nodaway
6,253
56.03%
4,886
43.78%
13
0.12%
9
0.08%
1,367
12.25%
11,161
Oregon
3,133
71.91%
1,214
27.86%
4
0.09%
6
0.14%
1,919
44.05%
4,357
Osage
2,672
51.68%
2,488
48.12%
4
0.08%
6
0.12%
184
3.56%
5,170
Ozark
859
30.33%
1,967
69.46%
2
0.07%
4
0.14%
-1,108
-39.13%
2,832
Pemiscot
10,269
81.98%
2,249
17.95%
1
0.01%
7
0.06%
8,020
64.03%
12,526
Perry
2,133
42.30%
2,903
57.56%
1
0.02%
6
0.12%
-770
-15.26%
5,043
Pettis
8,388
55.66%
6,657
44.18%
16
0.11%
8
0.05%
1,731
11.48%
15,069
Phelps
5,202
62.85%
3,053
36.89%
15
0.18%
7
0.08%
2,149
25.96%
8,277
Pike
4,934
66.68%
2,448
33.08%
7
0.09%
11
0.15%
2,486
33.60%
7,400
Platte
4,354
72.40%
1,644
27.34%
6
0.10%
10
0.17%
2,710
45.06%
6,014
Polk
3,079
43.32%
4,026
56.65%
1
0.01%
1
0.01%
-947
-13.33%
7,107
Pulaski
2,858
63.33%
1,644
36.43%
8
0.18%
3
0.07%
1,214
26.90%
4,513
Putnam
1,463
36.79%
2,499
62.84%
8
0.20%
7
0.18%
-1,036
-26.05%
3,977
Ralls
3,013
76.82%
908
23.15%
0
0.00%
1
0.03%
2,105
53.67%
3,922
Randolph
7,912
77.74%
2,256
22.17%
7
0.07%
3
0.03%
5,656
55.57%
10,178
Ray
4,826
69.57%
2,102
30.30%
4
0.06%
5
0.07%
2,724
39.27%
6,937
Reynolds
2,050
74.60%
692
25.18%
4
0.15%
2
0.07%
1,358
49.42%
2,748
Ripley
2,304
59.72%
1,533
39.74%
16
0.41%
5
0.13%
771
19.98%
3,858
St. Charles
6,049
50.14%
5,976
49.54%
23
0.19%
16
0.13%
73
0.60%
12,064
St. Clair
2,489
49.35%
2,548
50.52%
5
0.10%
2
0.04%
-59
-1.17%
5,044
St. Francois
7,276
53.73%
6,234
46.03%
23
0.17%
9
0.07%
1,042
7.70%
13,542
St. Louis
62,684
47.00%
69,592
52.17%
700
0.52%
407
0.31%
-6,908
-5.17%
133,383
St. Louis City
220,654
64.19%
120,656
35.10%
1638
0.48%
822
0.24%
99,998
29.09%
343,770
Ste. Genevieve
1,984
55.61%
1,567
43.92%
12
0.34%
5
0.14%
417
11.69%
3,568
Saline
7,185
59.73%
4,822
40.09%
13
0.11%
9
0.07%
2,363
19.64%
12,029
Schuyler
1,892
57.74%
1,377
42.02%
2
0.06%
6
0.18%
515
15.72%
3,277
Scotland
2,451
59.02%
1,693
40.77%
8
0.19%
1
0.02%
758
18.25%
4,153
Scott
8,266
76.52%
2,519
23.32%
8
0.07%
10
0.09%
5,747
53.20%
10,803
Shannon
2,352
74.10%
805
25.36%
8
0.25%
9
0.28%
1,547
48.74%
3,174
Shelby
3,400
71.43%
1,348
28.32%
11
0.23%
1
0.02%
2,052
43.11%
4,760
Stoddard
7,029
69.12%
3,117
30.65%
17
0.17%
6
0.06%
3,912
38.47%
10,169
Stone
892
28.58%
2,222
71.20%
5
0.16%
2
0.06%
-1,330
-42.62%
3,121
Sullivan
3,443
52.23%
3,140
47.63%
5
0.08%
4
0.06%
303
4.60%
6,592
Taney
1,427
37.58%
2,361
62.18%
6
0.16%
3
0.08%
-934
-24.60%
3,797
Texas
4,664
58.34%
3,320
41.53%
6
0.08%
4
0.05%
1,344
16.81%
7,994
Vernon
5,342
58.29%
3,808
41.55%
9
0.10%
5
0.05%
1,534
16.74%
9,164
Warren
1,071
30.88%
2,380
68.63%
7
0.20%
10
0.29%
-1,309
-37.75%
3,468
Washington
2,370
51.69%
2,200
47.98%
9
0.20%
6
0.13%
170
3.71%
4,585
Wayne
2,695
58.16%
1,937
41.80%
1
0.02%
1
0.02%
758
16.36%
4,634
Webster
3,292
47.78%
3,581
51.97%
9
0.13%
8
0.12%
-289
-4.19%
6,890
Worth
1,563
57.21%
1,162
42.53%
4
0.15%
3
0.11%
401
14.68%
2,732
Wright
2,505
41.35%
3,542
58.47%
8
0.13%
3
0.05%
-1,037
-17.12%
6,058
Totals
917,315
58.11%
655,039
41.49%
3,998
0.25%
2,222
0.14%
262,276
16.62%
1,578,628
Counties that flipped from Republican to Democratic
See also
Notes
^
References
"United States Presidential election of 1948 – Encyclopædia Britannica" . Retrieved October 26, 2017."1948 Election for the Forty-First Term (1949-53)" . Retrieved October 26, 2017."1948 Presidential General Election Results – Missouri" . Retrieved October 26, 2017."The American Presidency Project – Election of 1948" . Retrieved October 26, 2017.The Geography of Presidential Elections in the United States, 1868-2004 , pp. 239-246 ISBN 0786422173
‘How the Red and Blue Map Evolved Over the Past Century’ ; America Magazine in The National Catholic Review ; June 29, 2016
"MO US President Race, November 02, 1948" . Our Campaigns.
Categories :
Text is available under the Creative Commons Attribution-ShareAlike License. Additional terms may apply.
**DISCLAIMER** We are not affiliated with Wikipedia, and Cloudflare.
The information presented on this site is for general informational purposes only and does not constitute medical advice.
You should always have a personal consultation with a healthcare professional before making changes to your diet, medication, or exercise routine.
AI helps with the correspondence in our chat.
We participate in an affiliate program. If you buy something through a link, we may earn a commission 💕
↑
 County Results


