Main article: 1988 United States presidential election
| ||||||||||||||||||||||||||
| ||||||||||||||||||||||||||
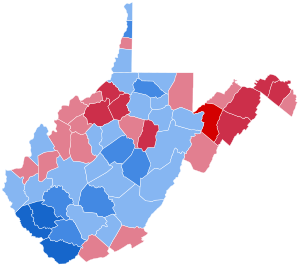
 County Results County Results
| ||||||||||||||||||||||||||
| ||||||||||||||||||||||||||
The 1988 United States presidential election in West Virginia took place on November 8, 1988. All 50 states and the District of Columbia were part of the 1988 United States presidential election. West Virginia voters chose six electors to the Electoral College, which selected the president and vice president.
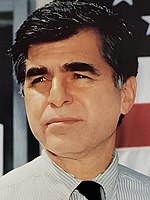
West Virginia was won by Massachusetts Governor Michael Dukakis who was running against incumbent United States Vice President George H. W. Bush of Texas. Dukakis ran with Texas Senator Lloyd Bentsen as Vice President, and Bush ran with Indiana Senator Dan Quayle.
West Virginia weighed in for this election as 13 percentage points more Democratic than the national average. As of 2024, this is the last time a Republican presidential candidate won the presidency without winning West Virginia. The 1988 election cycle is also the last time that West Virginia did not vote for the same presidential candidate as neighboring Kentucky.
The presidential election of 1988 was a very partisan election for West Virginia, with over 99% of the electorate voting for either the Republican or Democratic parties, and only three candidates appearing on the ballot. Dukakis won the election in West Virginia with a 5-point margin.
A rare event in any United States presidential election, West Virginia was home to a faithless elector in the election of 1988. During the assembly of the electoral college, one elector from West Virginia, Margarette Leach, cast her vote for the Democratic vice presidential nominee Lloyd Bentsen as president, and Dukakis as the vice president. She did this in order to draw attention to the lack of accountability for electors under the Electoral College system.
Results
| 1988 United States presidential election in West Virginia | |||||
|---|---|---|---|---|---|
| Party | Candidate | Votes | Percentage | Electoral votes | |
| Democratic | Michael Dukakis | 341,016 | 52.20% | 5 | |
| Republican | George H. W. Bush | 310,065 | 47.46% | 0 | |
| New Alliance Party | Lenora Fulani | 2,230 | 0.34% | 0 | |
| Democratic | Lloyd Bentsen | 0 | 0.00% | 1 | |
| Totals | 653,311 | 100.00% | 6 | ||
Results by county
| County | Michael Dukakis Democratic |
George H.W. Bush Republican |
Lenora Fulani New Alliance |
Margin | Total votes cast | ||||
|---|---|---|---|---|---|---|---|---|---|
| # | % | # | % | # | % | # | % | ||
| Barbour | 3,221 | 51.45% | 3,023 | 48.28% | 17 | 0.27% | 198 | 3.17% | 6,261 |
| Berkeley | 6,313 | 36.84% | 10,761 | 62.80% | 61 | 0.36% | -4,448 | -25.96% | 17,135 |
| Boone | 6,539 | 69.97% | 2,786 | 29.81% | 20 | 0.21% | 3,753 | 40.16% | 9,345 |
| Braxton | 3,377 | 62.27% | 2,024 | 37.32% | 22 | 0.41% | 1,353 | 24.95% | 5,423 |
| Brooke | 6,258 | 60.72% | 4,006 | 38.87% | 42 | 0.41% | 2,252 | 21.85% | 10,306 |
| Cabell | 15,368 | 47.05% | 17,197 | 52.65% | 97 | 0.30% | -1,829 | -5.60% | 32,662 |
| Calhoun | 1,644 | 53.78% | 1,395 | 45.63% | 18 | 0.59% | 249 | 8.15% | 3,057 |
| Clay | 2,263 | 59.38% | 1,536 | 40.30% | 12 | 0.31% | 727 | 19.08% | 3,811 |
| Doddridge | 955 | 33.54% | 1,880 | 66.03% | 12 | 0.42% | -925 | -32.49% | 2,847 |
| Fayette | 11,009 | 67.94% | 5,143 | 31.74% | 53 | 0.33% | 5,866 | 36.20% | 16,205 |
| Gilmer | 1,661 | 54.21% | 1,387 | 45.27% | 16 | 0.52% | 274 | 8.94% | 3,064 |
| Grant | 893 | 21.62% | 3,215 | 77.85% | 22 | 0.53% | -2,322 | -56.23% | 4,130 |
| Greenbrier | 6,091 | 52.87% | 5,395 | 46.83% | 35 | 0.30% | 696 | 6.04% | 11,521 |
| Hampshire | 2,085 | 38.88% | 3,253 | 60.66% | 25 | 0.47% | -1,168 | -21.78% | 5,363 |
| Hancock | 8,338 | 58.39% | 5,882 | 41.19% | 60 | 0.42% | 2,456 | 17.20% | 14,280 |
| Hardy | 1,689 | 39.39% | 2,581 | 60.19% | 18 | 0.42% | -892 | -20.80% | 4,288 |
| Harrison | 17,005 | 55.90% | 13,364 | 43.93% | 49 | 0.16% | 3,641 | 11.97% | 30,418 |
| Jackson | 4,573 | 44.44% | 5,696 | 55.35% | 22 | 0.21% | -1,123 | -10.91% | 10,291 |
| Jefferson | 4,334 | 44.56% | 5,349 | 55.00% | 43 | 0.44% | -1,015 | -10.44% | 9,726 |
| Kanawha | 41,144 | 51.73% | 38,140 | 47.95% | 258 | 0.32% | 3,004 | 3.78% | 79,542 |
| Lewis | 3,272 | 47.37% | 3,602 | 52.14% | 34 | 0.49% | -330 | -4.77% | 6,908 |
| Lincoln | 5,049 | 59.20% | 3,457 | 40.53% | 23 | 0.27% | 1,592 | 18.67% | 8,529 |
| Logan | 11,317 | 72.51% | 4,244 | 27.19% | 47 | 0.30% | 7,073 | 45.32% | 15,608 |
| Marion | 14,441 | 60.82% | 9,229 | 38.87% | 72 | 0.30% | 5,212 | 21.95% | 23,742 |
| Marshall | 7,903 | 53.47% | 6,793 | 45.96% | 83 | 0.56% | 1,110 | 7.51% | 14,779 |
| Mason | 5,468 | 50.51% | 5,332 | 49.26% | 25 | 0.23% | 136 | 1.25% | 10,825 |
| McDowell | 7,204 | 74.16% | 2,463 | 25.36% | 47 | 0.48% | 4,741 | 48.80% | 9,714 |
| Mercer | 10,152 | 49.69% | 10,221 | 50.03% | 57 | 0.28% | -69 | -0.34% | 20,430 |
| Mineral | 4,059 | 40.14% | 6,015 | 59.49% | 37 | 0.37% | -1,956 | -19.35% | 10,111 |
| Mingo | 7,429 | 71.78% | 2,896 | 27.98% | 25 | 0.24% | 4,533 | 43.80% | 10,350 |
| Monongalia | 14,178 | 53.83% | 12,091 | 45.91% | 69 | 0.26% | 2,087 | 7.92% | 26,338 |
| Monroe | 2,427 | 46.96% | 2,719 | 52.61% | 22 | 0.43% | -292 | -5.65% | 5,168 |
| Morgan | 1,545 | 33.85% | 3,002 | 65.78% | 17 | 0.37% | -1,457 | -31.93% | 4,564 |
| Nicholas | 5,173 | 57.89% | 3,731 | 41.75% | 32 | 0.36% | 1,442 | 16.14% | 8,936 |
| Ohio | 10,121 | 49.18% | 10,341 | 50.25% | 116 | 0.56% | -220 | -1.07% | 20,578 |
| Pendleton | 1,595 | 45.53% | 1,901 | 54.27% | 7 | 0.20% | -306 | -8.74% | 3,503 |
| Pleasants | 1,421 | 44.59% | 1,761 | 55.26% | 5 | 0.16% | -340 | -10.67% | 3,187 |
| Pocahontas | 1,958 | 50.83% | 1,876 | 48.70% | 18 | 0.47% | 82 | 2.13% | 3,852 |
| Preston | 4,357 | 42.73% | 5,804 | 56.92% | 35 | 0.34% | -1,447 | -14.19% | 10,196 |
| Putnam | 6,640 | 44.74% | 8,163 | 55.00% | 38 | 0.26% | -1,523 | -10.26% | 14,841 |
| Raleigh | 14,302 | 57.71% | 10,395 | 41.95% | 85 | 0.34% | 3,907 | 15.76% | 24,782 |
| Randolph | 5,233 | 52.24% | 4,746 | 47.38% | 38 | 0.38% | 487 | 4.86% | 10,017 |
| Ritchie | 1,446 | 33.33% | 2,874 | 66.25% | 18 | 0.41% | -1,428 | -32.92% | 4,338 |
| Roane | 2,447 | 45.89% | 2,861 | 53.66% | 24 | 0.45% | -414 | -7.77% | 5,332 |
| Summers | 3,072 | 57.81% | 2,231 | 41.98% | 11 | 0.21% | 841 | 15.83% | 5,314 |
| Taylor | 2,852 | 50.09% | 2,816 | 49.46% | 26 | 0.46% | 36 | 0.63% | 5,694 |
| Tucker | 1,869 | 52.25% | 1,699 | 47.50% | 9 | 0.25% | 170 | 4.75% | 3,577 |
| Tyler | 1,501 | 38.75% | 2,365 | 61.05% | 8 | 0.21% | -864 | -22.30% | 3,874 |
| Upshur | 3,065 | 38.83% | 4,813 | 60.97% | 16 | 0.20% | -1,748 | -22.14% | 7,894 |
| Wayne | 8,621 | 54.65% | 7,123 | 45.15% | 31 | 0.20% | 1,498 | 9.50% | 5,775 |
| Webster | 2,185 | 67.92% | 1,016 | 31.58% | 16 | 0.50% | 1,169 | 36.34% | 3,217 |
| Wetzel | 3,928 | 53.44% | 3,381 | 46.00% | 41 | 0.56% | 547 | 7.44% | 7,350 |
| Wirt | 929 | 44.97% | 1,125 | 54.45% | 12 | 0.58% | -196 | -9.48% | 2,066 |
| Wood | 12,959 | 39.80% | 19,450 | 59.73% | 154 | 0.47% | -6,491 | -19.93% | 32,563 |
| Wyoming | 6,138 | 63.38% | 3,516 | 36.31% | 30 | 0.31% | 2,622 | 27.07% | 9,684 |
| Totals | 341,016 | 52.20% | 310,065 | 47.46% | 2,230 | 0.34% | 30,951 | 4.74% | 653,311 |
Counties that flipped from Republican to Democratic
- Barbour
- Calhoun
- Gilmer
- Greenbrier
- Harrison
- Kanawha
- Marshall
- Mason
- Monongalia
- Nicholas
- Pocahontas
- Raleigh
- Randolph
- Summers
- Taylor
- Tucker
- Wayne
- Wetzel
See also
Notes
- A faithless Democratic elector voted for Bentsen for president and Dukakis for vice president
References
- "1988 Presidential General Election Results — West Virginia". Dave Leip’s U.S. Election Atlas. Retrieved July 21, 2013.
- "James A. Michener, Near-Faithless Elector". Slate. November 9, 2000. Retrieved June 20, 2019.
| State and district results of the 1988 U.S. presidential election | ||
|---|---|---|
|  | |
| (1986 ←) 1988 United States elections (→ 1990) | |
|---|---|
| President | |
| U.S. Senate |
|
| U.S. House |
|
| State governors | |
| State legislatures | |
| Mayors | |


