Main article: 1976 United States presidential election
1976 United States presidential election in West Virginia
Carter
50–60%
60–70%
70–80%
Ford
50–60%
60–70%
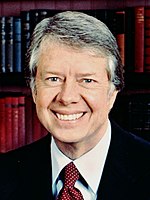
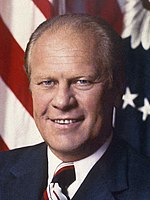
The 1976 United States presidential election in West Virginia took place on November 2, 1976, in West Virginia as part of the 1976 United States presidential election . The two major party candidates, Republican Gerald Ford and Democrat Jimmy Carter were the only candidates to appear on the state's ballot.
Carter won the state of West Virginia with 58.07 percent of the vote, carrying the state's 6 electoral votes. He had a 16.14 point margin over the incumbent President Ford. As of the 2020 presidential election , this is the last election in which Putnam County , Mineral County , and Hampshire County voted for a Democratic presidential candidate.
Results
Results by county
County
Jimmy Carter
Gerald Ford
Margin
Total votes cast
#
%
#
%
#
%
Barbour
3,647
52.99%
3,235
47.01%
412
5.98%
6,882
Berkeley
8,216
47.90%
8,935
52.10%
-719
-4.20%
17,151
Boone
8,528
73.52%
3,072
26.48%
5,456
47.04%
11,600
Braxton
4,012
67.71%
1,913
32.29%
2,099
35.42%
5,925
Brooke
8,197
63.11%
4,792
36.89%
3,405
26.22%
12,989
Cabell
20,811
51.44%
19,644
48.56%
1,167
2.88%
40,455
Calhoun
2,173
62.88%
1,283
37.12%
890
25.76%
3,456
Clay
2,662
67.49%
1,282
32.51%
1,380
34.98%
3,944
Doddridge
1,245
40.83%
1,804
59.17%
-559
-18.34%
3,049
Fayette
15,496
73.95%
5,459
26.05%
10,037
47.90%
20,955
Gilmer
2,245
62.09%
1,371
37.91%
874
24.18%
3,616
Grant
1,323
30.77%
2,976
69.23%
-1,653
-38.46%
4,299
Greenbrier
8,291
58.58%
5,862
41.42%
2,429
17.16%
14,153
Hampshire
3,104
59.68%
2,097
40.32%
1,007
19.36%
5,201
Hancock
10,627
61.08%
6,771
38.92%
3,856
22.16%
17,398
Hardy
2,993
61.70%
1,858
38.30%
1,135
23.40%
4,851
Harrison
21,467
58.59%
15,172
41.41%
6,295
17.18%
36,639
Jackson
5,334
49.88%
5,360
50.12%
-26
-0.24%
10,694
Jefferson
5,166
57.21%
3,864
42.79%
1,302
14.42%
9,030
Kanawha
53,602
55.94%
42,213
44.06%
11,389
11.88%
95,815
Lewis
3,960
51.46%
3,736
48.54%
224
2.92%
7,696
Lincoln
5,260
63.70%
2,997
36.30%
2,263
27.40%
8,257
Logan
13,122
76.54%
4,021
23.46%
9,101
53.08%
17,143
Marion
17,800
63.14%
10,391
36.86%
7,409
26.28%
28,191
Marshall
8,641
56.31%
6,705
43.69%
1,936
12.62%
15,346
Mason
6,769
56.53%
5,205
43.47%
1,564
13.06%
11,974
McDowell
10,557
71.99%
4,107
28.01%
6,450
43.98%
14,664
Mercer
14,761
57.77%
10,791
42.23%
3,970
15.54%
25,552
Mineral
5,898
53.48%
5,130
46.52%
768
6.96%
11,028
Mingo
8,655
74.20%
3,010
25.80%
5,645
48.40%
11,665
Monongalia
16,163
57.75%
11,827
42.25%
4,336
15.50%
27,990
Monroe
3,297
54.52%
2,750
45.48%
547
9.04%
6,047
Morgan
1,929
44.88%
2,369
55.12%
-440
-10.24%
4,298
Nicholas
6,235
64.30%
3,462
35.70%
2,773
28.60%
9,697
Ohio
11,817
48.64%
12,476
51.36%
-659
-2.72%
24,293
Pendleton
2,104
57.52%
1,554
42.48%
550
15.04%
3,658
Pleasants
1,699
51.38%
1,608
48.62%
91
2.76%
3,307
Pocahontas
2,330
57.25%
1,740
42.75%
590
14.50%
4,070
Preston
5,595
49.45%
5,719
50.55%
-124
-1.10%
11,314
Putnam
8,226
56.50%
6,334
43.50%
1,892
13.00%
14,560
Raleigh
19,768
65.02%
10,637
34.98%
9,131
30.04%
30,405
Randolph
7,265
60.11%
4,822
39.89%
2,443
20.22%
12,087
Ritchie
1,941
40.31%
2,874
59.69%
-933
-19.38%
4,815
Roane
3,519
52.25%
3,216
47.75%
303
4.50%
6,735
Summers
3,943
63.63%
2,254
36.37%
1,689
27.26%
6,197
Taylor
3,905
57.46%
2,891
42.54%
1,014
14.92%
6,796
Tucker
2,323
62.46%
1,396
37.54%
927
24.92%
3,719
Tyler
1,817
41.95%
2,514
58.05%
-697
-16.10%
4,331
Upshur
3,513
42.32%
4,789
57.68%
-1,276
-15.36%
8,302
Wayne
9,958
62.37%
6,009
37.63%
3,949
24.74%
15,967
Webster
2,931
75.12%
971
24.88%
1,960
50.24%
3,902
Wetzel
5,042
57.07%
3,793
42.93%
1,249
14.14%
8,835
Wirt
1,182
53.41%
1,031
46.59%
151
6.82%
2,213
Wood
17,075
48.16%
18,382
51.84%
-1,307
-3.69%
35,457
Wyoming
7,775
64.46%
4,286
35.54%
3,489
28.92%
12,061
Totals
435,914
58.07%
314,760
41.93%
121,154
16.14%
750,674
Counties that flipped from Republican to Democratic
References
"1976 Presidential General Election Results — West Virginia" . Retrieved June 11, 2016.Menendez, Albert J. The Geography of Presidential Elections in the United States, 1868-2004 . p. 337. ISBN 0786422173
"1976 General Election — Official Election Returns" (PDF). West Virginia Secretary of State . Retrieved February 23, 2022.
Categories :
Text is available under the Creative Commons Attribution-ShareAlike License. Additional terms may apply.
**DISCLAIMER** We are not affiliated with Wikipedia, and Cloudflare.
The information presented on this site is for general informational purposes only and does not constitute medical advice.
You should always have a personal consultation with a healthcare professional before making changes to your diet, medication, or exercise routine.
AI helps with the correspondence in our chat.
We participate in an affiliate program. If you buy something through a link, we may earn a commission 💕
↑
 County Results


