Part of the 2004 Irish local elections
2004 North Tipperary County Council election North Tipperary County Council
Council control after election TBD
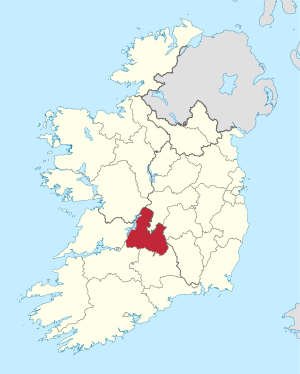
An election to North Tipperary County Council took place on 11 June 2004 as part of that year's Irish local elections . 21 councillors were elected from four local electoral areas (LEAs) for a five-year term of office on the electoral system of proportional representation by means of the single transferable vote (PR-STV).
Results by party
Results by local electoral area
Borrisokane
Borrisokane - 3 seats
Party
Candidate
FPv% Count
1
2
3
4
Independent
Michael O'Meara
25.78
1,283
Fianna Fáil
Jim Casey *
23.77
1,183
1,241
1,250
Fine Gael
Gerard Darcy *
16.17
805
886
894
1,092
Fine Gael
Louis McCormack
15.69
781
840
854
1,008
Fianna Fáil
Tony McKenna*
12.14
604
643
650
Sinn Féin
Aideen Rosney
3.25
162
Labour
Rose Tully
3.19
159
Electorate: 7,104 Valid: 4,977 (70.06%) Spoilt: 61 Quota: 1,245 Turnout: 5,038 (70.92%)
Nenagh
Nenagh - 7 seats
Party
Candidate
FPv% Count
1
2
3
4
5
6
Fianna Fáil
John Carroll *
10.92
1,414
1,472
1,497
1,579
1,652
Fine Gael
Tom Berkery 10.01
1,296
1,365
1,428
1,507
1,621
Fianna Fáil
Mattie (Coole) Ryan *
9.97
1,291
1,314
1,356
1,442
1,826
Fianna Fáil
John Sheehy
9.38
1,215
1,228
1,246
1,285
1,447
1,549
Labour
Seán Creamer *
9.24
1,197
1,246
1,481
1,639
Fianna Fáil
Tom Harrington *
8.99
1,164
1,216
1,274
1,332
1,420
1,452
Independent
Martin Kennedy*
8.48
1,098
1,130
1,140
1,209
Fine Gael
Phyll Bugler
8.06
1,044
1,084
1,191
1,245
1,413
1,456
Fianna Fáil
Tony Sheary*
7.71
998
1,088
1,186
1,332
1,347
1,377
Sinn Féin
Ella O'Dwyer
6.78
878
928
1,004
Labour
Virginia O'Dowd
5.53
716
821
Independent
Joe O'Connor
4.22
546
Independent
Noel Monteith
0.70
91
Electorate: 19,702 Valid: 12,948 (65.72%) Spoilt: 234 Quota: 1,619 Turnout: 13,182 (66.91%)
Templemore
Templemore - 5 seats
Party
Candidate
FPv% Count
1
2
3
4
5
6
7
Fine Gael
Pauline Coonan *
15.52
1,279
1,319
1,358
1,608
Fianna Fáil
John Hogan *
15.10
1,244
1,295
1,305
1,375
Fianna Fáil
Michael Smith
14.64
1,206
1,217
1,269
1,291
1,309
1,315
1,649
Fine Gael
Denis Ryan *
14.53
1,197
1,202
1,353
1,451
Fianna Fáil
Dr. Joe Hennessy *
10.46
862
878
903
947
989
1,000
1,233
Fianna Fáil
Seán Mulrooney*
8.94
737
739
797
799
805
807
Independent
Seán Fogarty
7.08
583
617
646
702
789
826
890
Fine Gael
Liam Brereton
6.46
532
550
563
Labour
P.J. Wright
4.39
362
407
Labour
Liam Leahy
2.89
238
Electorate: 12,441 Valid: 8,240 (66.23%) Spoilt: 150 Quota: 1,374 Turnout: 8,390 (67.44%)
Thurles
Thurles - 6 seats
Party
Candidate
FPv% Count
1
2
3
4
5
6
7
8
9
Independent
Michael Lowry, Jnr *
16.91
1,671
Independent
Jim Ryan
15.27
1,509
Fianna Fáil
Harry Ryan *
11.76
1,162
1,194
1,214
1,228
1,261
1,336
1,390
1,511
Fianna Fáil
Seamus Hanafin *
10.21
1,009
1,034
1,044
1,060
1,101
1,164
1,253
1,379
1,406
Independent
Willie Kennedy *
9.52
941
1,021
1,092
1,097
1,291
1,330
1,348
1,472
Fianna Fáil
John Egan*
8.01
792
804
822
827
905
944
963
1,023
1,041
Labour
John Kennedy
5.42
536
558
566
576
605
661
941
1,116
1,140
Labour
John Kenehan
5.20
514
535
546
561
583
653
Independent
Billy Clancy
4.77
471
485
506
510
Fine Gael
Mae Quinn*
4.76
470
492
655
665
690
800
866
Independent
Noel O'Dwyer
4.69
464
483
498
515
559
Fine Gael
John Ryan
3.49
345
356
Electorate: 15,201 Valid: 9,884 (65.02%) Spoilt: 133 Quota: 1,413 Turnout: 10,017 (65.90%)
External links
Categories :
Text is available under the Creative Commons Attribution-ShareAlike License. Additional terms may apply.
**DISCLAIMER** We are not affiliated with Wikipedia, and Cloudflare.
The information presented on this site is for general informational purposes only and does not constitute medical advice.
You should always have a personal consultation with a healthcare professional before making changes to your diet, medication, or exercise routine.
AI helps with the correspondence in our chat.
We participate in an affiliate program. If you buy something through a link, we may earn a commission 💕
↑
 Map showing the area of North Tipperary County Council