Part of the 2004 Irish local elections
2004 Roscommon County Council election Roscommon County Council
Council control after election TBD
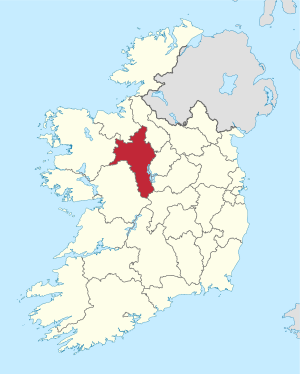
An election to Roscommon County Council took place on 11 June 2004 as part of that year's Irish local elections . 26 councillors were elected from six local electoral areas (LEAs) for a five-year term of office on the electoral system of proportional representation by means of the single transferable vote (PR-STV).
Results by party
Results by local electoral area
Athlone
Athlone - 5 seats
Party
Candidate
FPv% Count
1
2
3
4
5
6
7
Fine Gael
John Naughten *
23.93
1,564
Fianna Fáil
Trevor Finneran *
16.59
1,084
1,123
Fine Gael
Ollie Moore *
12.88
842
1,013
1,021
1,273
Fianna Fáil
Anthony Geraghty *
11.03
721
744
750
780
793
1,106
Independent
Tony Ward
10.36
677
719
721
821
859
963
970
Fine Gael
Christine O'Malley
8.36
581
672
674
779
875
951
960
Progressive Democrats
Eugene Costello
8.29
542
574
580
Fianna Fáil
John Curran*
7.77
524
600
609
638
654
Electorate: 9,727 Valid: 6,535 (67.18%) Spoilt: 96 Quota: 1,090 Turnout: 6,631 (68.17%)
Ballaghadreen
Ballaghadreen - 4 seats
Party
Candidate
FPv% Count
1
2
3
4
5
6
7
8
Independent
John Kelly 22.83
1,101
Sinn Féin
Michael Mulligan
12.75
615
649
699
769
859
919
1,103
Fine Gael
John Connor 12.73
614
628
660
685
696
832
992
Fine Gael
Michael Creaton
11.76
567
580
592
617
626
667
781
828
Fine Gael
Michael Scally*
9.39
453
468
474
520
605
619
Fianna Fáil
Paul Lynch
9.21
444
454
458
477
569
678
717
756
Fianna Fáil
John Mulvihil
7.05
340
347
373
383
417
Fianna Fáil
Paddy McGarry*
6.39
308
321
329
366
Independent
Mary Durkin
4.46
215
236
260
Independent
P.J. Keenan
2.88
139
147
Green
Eamonn Ansbro
0.54
26
27
Electorate: 7,437 Valid: 4,822 (64.84%) Spoilt: 89 Quota: 965 Turnout: 4,911 (66.03%)
Boyle
Boyle - 5 seats
Party
Candidate
FPv% Count
1
2
3
4
5
6
7
8
Fianna Fáil
John Cummins *
18.87
1,088
Fine Gael
Charlie Hopkins *
14.10
813
816
824
837
845
876
938
963
Fine Gael
Gerry Garvey *
13.35
770
771
774
782
788
812
969
Fine Gael
Ernie Keenan *
12.68
731
758
776
792
886
1,035
Fianna Fáil
Rachel Doherty
10.98
633
659
668
692
723
767
833
861
Fianna Fáil
Alo O'Dowd
10.23
590
615
618
622
633
653
760
776
Fine Gael
Kitty Duignan*
7.27
419
433
443
453
470
511
Labour
Tommy Egan
5.10
294
305
331
363
406
Independent
Francis Geelan
3.38
195
202
222
241
Green
Catherine Ansbro
2.38
137
139
142
Independent
Malachy Beirne
1.68
97
106
Electorate: 8,505 Valid: 5,767 (67.81%) Spoilt: 58 Quota: 962 Turnout: 5,825 (68.49%)
Castlerea
Castlerea - 3 seats
Party
Candidate
FPv% Count
1
2
3
4
Independent
Luke Flanagan 28.23
1,050
Fianna Fáil
Tony Waldron
23.80
885
911
1,089
Fine Gael
Michael McGreal *
20.49
762
780
872
913
Fine Gael
John Murray*
12.88
563
594
745
819
Independent
Danny Burke*
11.03
459
504
Electorate: 5,474 Valid: 3,719 (67.94%) Spoilt: 47 Quota: 930 Turnout: 3,766 (68.80%)
Roscommon
Roscommon - 5 seats
Party
Candidate
FPv% Count
1
2
3
4
5
6
7
Fianna Fáil
Martin Connaughton *
13.07
876
900
916
973
994
1,044
1,074
Independent
Paula McNamara *
12.22
819
864
895
939
1,030
1,152
Fine Gael
Dominick Connolly
12.01
805
834
867
902
1,036
1,345
Fianna Fáil
Orla Leyden
11.74
787
807
831
938
981
1,061
1,101
Fianna Fáil
Des Bruen*
11.62
779
785
803
883
908
959
1,012
Fianna Fáil
Paddy Kilduff
11.11
745
755
780
811
890
1,019
1,074
Fine Gael
Padraig Walsh
8.28
555
562
621
650
790
Fine Gael
Teresa Donnelly
6.83
458
472
530
547
Fianna Fáil
P Burke
6.37
427
435
444
Progressive Democrats
Jimmy Murray
3.89
261
277
Sinn Féin
Patrick Carton
2.12
142
Green
Bridget Banham
0.75
50
Electorate: 9,698 Valid: 6,704 (69.13%) Spoilt: 51 Quota: 1,118 Turnout: 6,755 (69.65%)
Strokestown
Strokestown - 4 seats
Party
Candidate
FPv% Count
1
2
3
4
5
6
Fianna Fáil
Eugene Murphy *
19.78
983
1,013
Independent
Tom Crosby *
19.56
972
992
997
Independent
Valerie Byrne *
16.26
808
861
866
906
953
1,131
Fine Gael
Seán Beirne *
16.22
806
839
843
864
889
966
Fine Gael
Leo Cox
7.30
363
367
367
377
501
587
Labour
Hughie Baxter
6.34
315
329
330
430
471
Fianna Fáil
Seamus Nugent
5.69
283
286
287
362
Fianna Fáil
Gerry Thompson
5.45
271
271
273
Sinn Féin
John Reynolds
3.40
169
Electorate: 7,088 Valid: 4,970 (70.12%) Spoilt: 72 Quota: 995 Turnout: 5,042 (71.13%)
External links
Categories :
Text is available under the Creative Commons Attribution-ShareAlike License. Additional terms may apply.
**DISCLAIMER** We are not affiliated with Wikipedia, and Cloudflare.
The information presented on this site is for general informational purposes only and does not constitute medical advice.
You should always have a personal consultation with a healthcare professional before making changes to your diet, medication, or exercise routine.
AI helps with the correspondence in our chat.
We participate in an affiliate program. If you buy something through a link, we may earn a commission 💕
↑
 Map showing the area of Roscommon County Council