Burnley Borough Council elections are generally held three years out of every four, with a third of the council elected each time. Burnley Borough Council is the local authority for the non-metropolitan district of Burnley in Lancashire, England. Since the last boundary changes in 2002, 45 councillors have been elected from 15 wards.

Council elections
- 1973 Burnley Borough Council election
- 1976 Burnley Borough Council election (New ward boundaries)
- 1979 Burnley Borough Council election
- 1980 Burnley Borough Council election
- 1982 Burnley Borough Council election
- 1983 Burnley Borough Council election
- 1984 Burnley Borough Council election
- 1986 Burnley Borough Council election
- 1987 Burnley Borough Council election (Borough boundary changes took place but the number of seats remained the same)
- 1988 Burnley Borough Council election
- 1990 Burnley Borough Council election
- 1991 Burnley Borough Council election (New ward boundaries)
- 1992 Burnley Borough Council election
- 1994 Burnley Borough Council election
- 1995 Burnley Borough Council election
- 1996 Burnley Borough Council election
- 1998 Burnley Borough Council election
- 1999 Burnley Borough Council election
- 2000 Burnley Borough Council election
- 2002 Burnley Borough Council election (New ward boundaries reduced the number of seats by 3)
- 2003 Burnley Borough Council election
- 2004 Burnley Borough Council election
- 2006 Burnley Borough Council election
- 2007 Burnley Borough Council election
- 2008 Burnley Borough Council election
- 2010 Burnley Borough Council election
- 2011 Burnley Borough Council election
- 2012 Burnley Borough Council election
- 2014 Burnley Borough Council election
- 2015 Burnley Borough Council election
- 2016 Burnley Borough Council election
- 2018 Burnley Borough Council election
- 2019 Burnley Borough Council election
- 2021 Burnley Borough Council election
- 2022 Burnley Borough Council election
- 2023 Burnley Borough Council election
- 2024 Burnley Borough Council election
Result maps
-
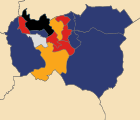
 2003 British National Party: 7 Labour Party (UK): 5 Liberal Democrats (UK): 2 Conservative Party (UK): 1 Independent (politician): 1
-
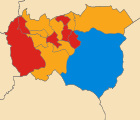
 2010 Liberal Democrats (UK): 9 Labour Party (UK): 6 Conservative Party (UK): 1
-
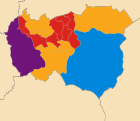
 2012 Labour Party (UK): 11 Liberal Democrats (UK): 2 Conservative Party (UK): 2
-
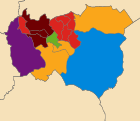
 2016 Labour Party (UK): 8 Liberal Democrats (UK): 5 Conservative Party (UK): 1 UK Independence Party: 1
-
 2018 Labour Party (UK): 7 Liberal Democrats (UK): 3 Conservative Party (UK): 2 Burnley and Padiham Independent Party: 1 Green Party of England and Wales: 1 UK Independence Party: 1
-
 2019 Labour Party (UK): 6 Liberal Democrats (UK): 3 Burnley and Padiham Independent Party: 3 Conservative Party (UK): 1 Green Party of England and Wales: 1 UK Independence Party: 1
-
 2021 Labour Party (UK): 5 Conservative Party (UK): 4 Green Party of England and Wales: 3 Liberal Democrats (UK): 2 Burnley and Padiham Independent Party: 1
-
 2022 Labour Party (UK): 7 Liberal Democrats (UK): 3 Conservative Party (UK): 2 Green Party of England and Wales: 2 Liberal Democrats (UK): 3 Burnley and Padiham Independent Party: 1
-
 2023 Labour Party (UK): 8 Conservative Party (UK): 2 Liberal Democrats (UK): 2 Green Party of England and Wales: 2 Burnley and Padiham Independent Party: 1
-
 2024 Labour Party (UK): 6 Conservative Party (UK): 3 Independent: 3 Liberal Democrats (UK): 2 Green Party of England and Wales: 1
By-election results
1998-2002
| Party | Candidate | Votes | % | ±% | |
|---|---|---|---|---|---|
| Conservative | 611 | 59.4 | +11.6 | ||
| Labour | 417 | 40.6 | −11.6 | ||
| Majority | 194 | 18.8 | |||
| Turnout | 1,028 | ||||
| Conservative gain from Labour | Swing | ||||
| Party | Candidate | Votes | % | ±% | |
|---|---|---|---|---|---|
| Independent | Samuel Holgate | 467 | 38.8 | −33.0 | |
| Labour | 421 | 35.0 | +6.8 | ||
| BNP | 283 | 23.5 | +23.5 | ||
| Socialist Alliance | 32 | 2.7 | +2.7 | ||
| Majority | 46 | 3.8 | |||
| Turnout | 1,203 | 27.8 | |||
| Independent hold | Swing | ||||
| Party | Candidate | Votes | % | ±% | |
|---|---|---|---|---|---|
| Labour | Elizabeth Monk | 555 | 57.9 | +1.3 | |
| BNP | 181 | 18.9 | +18.9 | ||
| Independent | 172 | 18.0 | +18.0 | ||
| Socialist Alliance | 50 | 5.2 | +5.2 | ||
| Majority | 374 | 39.0 | |||
| Turnout | 958 | 28.8 | |||
| Labour hold | Swing | ||||
| Party | Candidate | Votes | % | ±% | |
|---|---|---|---|---|---|
| Labour | Denis Otter | 380 | 31.7 | +9.0 | |
| Independent | 284 | 23.7 | −24.1 | ||
| BNP | 230 | 19.2 | +19.2 | ||
| Liberal Democrats | 203 | 16.9 | +16.9 | ||
| Conservative | 101 | 8.4 | −21.1 | ||
| Majority | 96 | 8.0 | |||
| Turnout | 1,198 | 28.8 | |||
| Labour gain from Independent | Swing | ||||
2002–2006
| Party | Candidate | Votes | % | ±% | |
|---|---|---|---|---|---|
| Liberal Democrats | Peter McCann | 788 | 33.1 | +33.1 | |
| BNP | Andy Kenyon | 777 | 32.6 | −6.4 | |
| Labour | Andy Tatchell | 679 | 28.5 | −5.9 | |
| Independent | Patricia Stinton | 76 | 3.2 | −15.6 | |
| Conservative | Alan Marsden | 62 | 2.6 | −5.2 | |
| Majority | 11 | 0.5 | |||
| Turnout | 2,382 | 53.5 | |||
| Liberal Democrats gain from Labour | Swing | ||||
| Party | Candidate | Votes | % | ±% | |
|---|---|---|---|---|---|
| Liberal Democrats | Martin Smith | 1,070 | 50.6 | +32.0 | |
| Labour | Julie Cooper | 464 | 21.9 | −9.8 | |
| BNP | John Cave | 357 | 16.9 | −17.1 | |
| Independent | Ann Royle | 127 | 6.0 | −9.8 | |
| Conservative | Paul Coates | 98 | 4.6 | +4.6 | |
| Majority | 606 | 28.7 | |||
| Turnout | 2,116 | 48.2 | |||
| Liberal Democrats gain from BNP | Swing | ||||
| Party | Candidate | Votes | % | ±% | |
|---|---|---|---|---|---|
| Labour | Julie Cooper | 1,056 | 48.0 | −2.2 | |
| Liberal Democrats | Abdul Hamid | 514 | 23.3 | −2.7 | |
| BNP | Derek Dawson | 368 | 16.7 | +16.7 | |
| Conservative | Paul Coates | 266 | 12.0 | −11.8 | |
| Majority | 542 | 24.7 | |||
| Turnout | 2,204 | 53.5 | |||
| Labour hold | Swing | ||||
2006–2010
| Party | Candidate | Votes | % | ±% | |
|---|---|---|---|---|---|
| Liberal Democrats | Allen Harris | 875 | 44.1 | +16.3 | |
| BNP | Paul McDevitt | 538 | 27.1 | +0.6 | |
| Labour | Karen Baker | 479 | 24.2 | −6.7 | |
| Conservative | Tony Coulson | 90 | 4.5 | −10.2 | |
| Majority | 337 | 17.0 | |||
| Turnout | 1,982 | 39.9 | |||
| Liberal Democrats gain from Labour | Swing | ||||
| Party | Candidate | Votes | % | ±% | |
|---|---|---|---|---|---|
| Labour | Shah Hussain | 944 | 46.6 | −3.7 | |
| Liberal Democrats | Mohammed Malik | 906 | 44.7 | −5.0 | |
| England First | Steven Smith | 141 | 7.0 | +7.0 | |
| Conservative | Alan Marsden | 35 | 1.7 | +1.7 | |
| Majority | 38 | 1.9 | |||
| Turnout | 2,026 | 52.4 | |||
| Labour gain from Liberal Democrats | Swing | ||||
| Party | Candidate | Votes | % | ±% | |
|---|---|---|---|---|---|
| Liberal Democrats | Iris Gates | 645 | 41.2 | +1.1 | |
| BNP | John Cave | 400 | 25.6 | −5.4 | |
| Labour | Charles Baker | 304 | 19.4 | +1.0 | |
| Conservative | Barry Elliott | 215 | 13.7 | +3.4 | |
| Majority | 245 | 15.6 | |||
| Turnout | 1,564 | 32.8 | |||
| Liberal Democrats hold | Swing | ||||
2010–2014
| Party | Candidate | Votes | % | ±% | |
|---|---|---|---|---|---|
| Labour | Beatrice Foster | 521 | 43.1 | +11.8 | |
| BNP | Paul McDevitt | 288 | 23.8 | +5.4 | |
| Liberal Democrats | Kate Mottershead | 261 | 21.6 | −11.8 | |
| Conservative | Mathew Isherwood | 81 | 6.7 | −10.2 | |
| Independent | Andrew Hennessey | 58 | 4.8 | +4.8 | |
| Majority | 233 | 19.3 | |||
| Turnout | 1,209 | ||||
| Labour gain from Liberal Democrats | Swing | ||||
| Party | Candidate | Votes | % | ±% | |
|---|---|---|---|---|---|
| Labour | Tony Martin | 493 | 49.3 | −8.8 | |
| Liberal Democrats | Stephanie Forrest | 256 | 25.6 | −5.8 | |
| Conservative | Tom Watson | 96 | 9.6 | +9.6 | |
| BNP | Derek Dawson | 95 | 9.5 | −1.1 | |
| UKIP | Craig Ramplee | 35 | 3.5 | 3.5 | |
| National Front | Steven Smith | 26 | 2.6 | +2.6 | |
| Majority | 237 | 23.7 | |||
| Turnout | 1,001 | ||||
| Labour hold | Swing | ||||
2018-2022
| Party | Candidate | Votes | % | ±% | |
|---|---|---|---|---|---|
| Liberal Democrats | Peter McCann | 341 | 37.5 | −11.0 | |
| Labour | Andy Devanney | 249 | 27.4 | −6.8 | |
| BAPIP | Paula Riley | 154 | 16.9 | +16.9 | |
| Conservative | Phil Chamberlain | 115 | 12.6 | −0.4 | |
| Green | Victoria Alker | 51 | 5.6 | +1.3 | |
| Majority | 92 | 10.1 | |||
| Turnout | 910 | ||||
| Liberal Democrats hold | Swing | ||||
2022-2026
| Party | Candidate | Votes | % | ±% | |
|---|---|---|---|---|---|
| Labour | Bill Horrocks | 372 | 39.4 | +15.8 | |
| Liberal Democrats | Russell Neal | 363 | 38.4 | −17.8 | |
| Conservative | Maison McGowan-Doe | 123 | 13.0 | −2.1 | |
| Green | Anthony Davis | 87 | 9.2 | +4.1 | |
| Majority | 9 | 1.0 | |||
| Turnout | 945 | ||||
| Labour gain from Conservative | Swing | ||||
| Party | Candidate | Votes | % | ±% | |
|---|---|---|---|---|---|
| Green | Alexander Hall | 347 | 59.5 | −4.5 | |
| Labour | Mubashar Lone | 163 | 28.0 | +1.0 | |
| Conservative | Susan Nutter | 73 | 12.5 | +3.5 | |
| Majority | 184 | 1.0 | |||
| Turnout | 583 | ||||
| Green hold | Swing | ||||
References
- "The Borough of Burnley (Electoral Changes) Order 2001", legislation.gov.uk, The National Archives, SI 2001/2473, retrieved 25 August 2022
- "The Borough of Burnley (Electoral Arrangements) Order 1976". legislation.gov.uk. 13 February 1976. Retrieved 19 November 2015.
- The Lancashire (District Boundaries) Order 1986
- "The Borough of Burnley (Electoral Arrangements) Order 1990". legislation.gov.uk. 25 September 1990. Retrieved 4 November 2015.
- "Burnley". BBC Online. Retrieved 13 November 2008.
- "The Borough of Burnley (Electoral Changes) Order 2001". legislation.gov.uk. 3 July 2001. Retrieved 4 October 2015.
- "The Borough of Burnley (Electoral Changes) (Amendment) Order 2002". legislation.gov.uk. 2 December 2002. Retrieved 4 October 2015.
- Carter, Helen (21 June 2003). "Relief in Burnley at narrow BNP defeat". The Guardian. p. 12.
- "BNP are beaten in by-election". Prestwich & Whitefield Guide. 17 October 2003. Retrieved 20 December 2009.
- "Seats slip from BNP control". BBC News Online. 16 October 2003. Retrieved 20 December 2009.
- "Declaration of result poll". Burnley Borough Council. Archived from the original on 15 June 2011. Retrieved 20 December 2009.
- "DECLARATION OF RESULT POLL". Burnley.gov.uk. Archived from the original on 15 June 2011. Retrieved 13 November 2008.
- "DECLARATION OF RESULT POLL". Burnley.gov.uk. Archived from the original on 15 June 2011. Retrieved 13 November 2008.
- "Declaration of result poll". Burnley Borough Council. Archived from the original on 15 June 2011. Retrieved 20 December 2009.
- "Local Elections Archive Project — Rosegrove with Lowerhouse Ward". www.andrewteale.me.uk. Retrieved 13 September 2022.
- "Local Elections Archive Project — Trinity Ward". www.andrewteale.me.uk. Retrieved 13 September 2022.
- "Local Elections Archive Project — Rosehill with Burnley Wood Ward". www.andrewteale.me.uk. Retrieved 13 September 2022.
- "Local Elections Archive Project — Rosehill with Burnley Wood Ward". www.andrewteale.me.uk. Retrieved 13 September 2022.
- "Local Elections Archive Project — Trinity Ward". www.andrewteale.me.uk. Retrieved 13 September 2022.
- By-election results Archived 29 March 2010 at the Wayback Machine
External links
| Lancashire County Council | |
|---|---|
| Blackburn with Darwen | |
| Blackpool | |
| Burnley | |
| Chorley | |
| Fylde | |
| Hyndburn | |
| Lancaster | |
| Pendle | |
| Preston | |
| Ribble Valley | |
| Rossendale | |
| South Ribble | |
| West Lancashire | |
| Wyre | |
| |
| Culture and infrastructure of the Borough of Burnley | ||||||||||
|---|---|---|---|---|---|---|---|---|---|---|
| Transport |
|  | ||||||||
| Education | ||||||||||
| Sport | ||||||||||
| History |
| |||||||||
| Media | ||||||||||
| Politics | ||||||||||