(Redirected from Colorado Republican caucuses, 2012 )
Main article: 2012 United States presidential election
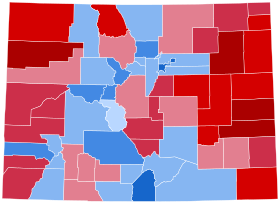
2012 United States presidential election in Colorado Turnout 71.17%
Obama
40–50%
50–60%
60–70%
70–80%
Romney
50–60%
60–70%
70–80%
80–90%
The 2012 United States presidential election in Colorado took place on November 6, 2012, as part of the 2012 United States presidential election in which all 50 states plus the District of Columbia participated. Colorado voters chose nine electors to represent them in the Electoral College via a popular vote pitting incumbent Democratic President Barack Obama and his running mate, Vice President Joe Biden , against Republican challenger and former Massachusetts Governor Mitt Romney and his running mate, U.S. Representative Paul Ryan . Obama and Biden carried Colorado with 51.48% of the popular vote to Romney's and Ryan's 46.12%, thus winning the state's nine electoral votes by a 5.36% margin.
Caucuses
Democratic caucuses
Incumbent President Barack Obama ran unopposed in the Colorado Democratic caucuses.
Republican caucuses
Main article: 2012 Colorado Republican presidential caucuses
The 2012 Colorado Republican presidential caucuses took place on 7 February 2012. It was part of the 2012 Republican Party presidential primaries . The race was widely expected to be won by Mitt Romney even on the day of the caucus, but a strong surge by Rick Santorum across all three races that day carried him to a close victory; however, the delegates were not legally bound to follow voter preferences and most voted for Romney.
General election
Ballot access
On the campaign trail, President Obama watches as graduates toss their hats during the United States Air Force Academy commencement ceremony at Falcon Stadium , USAF Academy in Colorado Springs , May 23, 2012. Virgil Goode/Jim Clymer, Constitution
Barack Obama/Joseph Biden, Democratic
Mitt Romney/Paul Ryan, Republican
Gary Johnson/James P. Gray, Libertarian
Jill Stein/Cheri Honkala, Green
Stewart Alexander/Alex Mendoza, Socialist
Rocky Anderson/Luis J. Rodriguez, Justice
Roseanne Barr/Cindy Shehan, Peace and Freedom
James Harris/Alyson Kennedy, Socialist Workers
Tom Hoefling/J.D. Ellis, America's
Gloria La Riva/Filberto Ramirez Jr., Socialism and Liberation
Merlin Miller/Harry V. Bertram, American Third Position
Jill Reed/Tom Cary, Twelve Visions Party
Thomas Robert Stevens/Alden Link, Objectivist
Shella "Samm" Tittle/Matthew A. Turner, We the People
Jerry White/Phyllis Scherrer, Socialist Equality Polling
See also: Statewide opinion polling for the 2012 United States presidential election § Colorado
Incumbent Barack Obama started off with a wide lead in polls ranging from 1 to 13 points, which continued throughout the early summer of 2012. On August 6, Romney won his first poll, 50% to 45%. Throughout the rest of the summer, and September, with the exception of a few points, Obama won almost every poll but narrowly. Romney gained momentum in October, and the race was essentially tied, with neither candidate taking a significant lead. The last week before the election, Obama gained momentum and won each of the 4 pre-election polls. The average of the last 3 pre-election polls showed Obama leading Romney 49.7% to 46.3%. The final pre-election poll showed Obama leading Romney 52% to 46%, which was accurate compared to the results. Washington Post rated this race "Toss-Up."
Predictions
Results
2012 United States presidential election in Colorado
Party
Candidate
Running mate
Votes
Percentage
Electoral votes
Democratic Barack Obama (incumbent)
Joe Biden (incumbent)
1,323,102
51.45%
9
Republican
Mitt Romney
Paul Ryan
1,185,243
46.09%
0
Libertarian
Gary Johnson
Jim Gray
35,545
1.38%
0
Green
Jill Stein
Cheri Honkala
7,508
0.29%
0
Constitution
Virgil Goode
Jim Clymer
6,234
0.24%
0
Peace & Freedom
Roseanne Barr
Cindy Sheehan
5,059
0.20%
0
Unaffiliated
Jill Ann Reed
Tom Cary
2,589
0.10%
0
Justice
Rocky Anderson
Luis J. Rodriguez
1,260
0.05%
0
Others
Others
1,028
0.04%
0
America's Party
Thomas Hoefling
Jonathan D. Ellis
679
0.03%
0
Socialism and Liberation
Gloria La Riva
Filberto Ramirez Jr.
317
0.01%
0
Socialist
Stewart Alexander
Alex Mendoza
308
0.01%
0
American Third Position
Merlin Miller
Harry Bertram
266
0.01%
0
Socialist Workers
James Harris
Alyson Kennedy
192
0.01%
0
Socialist Equality
Jerry White
Phyllis Scherrer
189
0.01%
0
Totals
2,569,518
100.00%
9
By county
County
Barack Obama
Mitt Romney
Various candidates
Margin
Total votes cast
#
%
#
%
#
%
#
%
Adams
100,649
56.90%
70,972
40.12%
5,272
2.98%
29,677
16.78%
176,893
Alamosa
3,811
56.75%
2,705
40.28%
199
2.97%
1,106
16.47%
6,715
Arapahoe
153,905
53.90%
125,588
43.99%
6,023
2.11%
28,317
9.91%
285,516
Archuleta
2,679
39.78%
3,872
57.50%
183
2.72%
-1,193
-17.72%
6,734
Baca
467
22.17%
1,559
74.03%
80
3.80%
-1,092
-51.86%
2,106
Bent
815
41.97%
1,075
55.36%
52
2.67%
-260
-13.39%
1,942
Boulder
125,091
69.69%
49,981
27.84%
4,427
2.47%
75,110
41.85%
179,499
Broomfield
16,966
51.62%
15,008
45.67%
891
2.71%
1,958
5.95%
32,865
Chaffee
5,086
48.61%
5,070
48.46%
306
2.93%
16
0.15%
10,462
Cheyenne
172
15.74%
889
81.34%
32
2.92%
-717
-65.60%
1,093
Clear Creek
3,119
54.31%
2,430
42.31%
194
3.38%
689
12.00%
5,743
Conejos
2,213
53.96%
1,835
44.75%
53
1.29%
378
9.21%
4,101
Costilla
1,340
72.95%
446
24.28%
51
2.77%
894
48.67%
1,837
Crowley
535
35.62%
924
61.52%
43
2.86%
-389
-25.90%
1,502
Custer
868
31.97%
1,788
65.86%
59
2.17%
-920
-33.89%
2,715
Delta
4,622
29.02%
10,915
68.54%
388
2.44%
-6,293
-39.52%
15,925
Denver
222,018
73.41%
73,111
24.18%
7,289
2.41%
148,907
49.23%
302,418
Dolores
334
26.83%
859
69.00%
52
4.17%
-525
-42.17%
1,245
Douglas
61,094
36.35%
104,397
62.11%
2,593
1.54%
-43,303
-25.76%
168,084
Eagle
12,792
56.43%
9,411
41.52%
465
2.05%
3,381
14.91%
22,668
El Paso
111,819
38.54%
170,952
58.91%
7,404
2.55%
-59,133
-20.37%
290,175
Elbert
3,603
25.41%
10,266
72.41%
309
2.18%
-6,663
-47.00%
14,178
Fremont
6,704
32.84%
13,174
64.53%
538
2.63%
-6,470
-31.69%
20,416
Garfield
11,305
46.32%
12,535
51.36%
568
2.32%
-1,230
-5.04%
24,408
Gilpin
1,892
56.68%
1,346
40.32%
100
3.00%
546
16.36%
3,338
Grand
3,684
45.00%
4,253
51.95%
250
3.05%
-569
-6.95%
8,187
Gunnison
5,044
58.20%
3,341
38.55%
282
3.25%
1,703
19.65%
8,667
Hinsdale
229
38.17%
353
58.83%
18
3.00%
-124
-20.66%
600
Huerfano
1,953
52.46%
1,646
44.21%
124
3.33%
307
8.25%
3,723
Jackson
216
25.47%
600
70.75%
32
3.78%
-384
-45.28%
848
Jefferson
159,296
51.21%
144,197
46.36%
7,559
2.43%
15,099
4.85%
311,052
Kiowa
118
14.37%
677
82.46%
26
3.17%
-559
-68.09%
821
Kit Carson
838
22.64%
2,785
75.23%
79
2.13%
-1,947
-52.59%
3,702
La Plata
15,489
52.85%
12,794
43.65%
1,025
3.50%
2,695
9.20%
29,308
Lake
1,839
60.49%
1,098
36.12%
103
3.39%
741
24.37%
3,040
Larimer
92,747
51.47%
82,376
45.72%
5,057
2.81%
10,371
5.75%
180,180
Las Animas
3,445
50.20%
3,263
47.55%
154
2.25%
182
2.65%
6,862
Lincoln
552
24.14%
1,687
73.76%
48
2.10%
-1,135
-49.62%
2,287
Logan
2,712
29.72%
6,179
67.72%
233
2.56%
-3,467
-38.00%
9,124
Mesa
23,846
32.69%
47,472
65.08%
1,629
2.23%
-23,626
-32.39%
72,947
Mineral
291
44.77%
344
52.92%
15
2.31%
-53
-8.15%
650
Moffat
1,330
21.56%
4,695
76.12%
143
2.32%
-3,365
-54.56%
6,168
Montezuma
4,542
36.87%
7,401
60.08%
375
3.05%
-2,859
-23.21%
12,318
Montrose
6,138
30.49%
13,552
67.32%
440
2.19%
-7,414
-36.83%
20,130
Morgan
3,912
36.30%
6,602
61.26%
263
2.44%
-2,690
-24.96%
10,777
Otero
3,647
44.52%
4,382
53.49%
163
1.99%
-735
-8.97%
8,192
Ouray
1,646
51.41%
1,481
46.25%
75
2.34%
165
5.16%
3,202
Park
3,862
41.23%
5,236
55.90%
268
2.87%
-1,374
-14.67%
9,366
Phillips
588
25.96%
1,637
72.27%
40
1.77%
-1,049
-46.31%
2,265
Pitkin
6,849
67.98%
3,024
30.01%
202
2.01%
3,825
37.97%
10,075
Prowers
1,519
31.24%
3,230
66.42%
114
2.34%
-1,711
-35.18%
4,863
Pueblo
42,551
55.68%
31,894
41.74%
1,974
2.58%
10,657
13.94%
76,419
Rio Blanco
568
16.86%
2,724
80.85%
77
2.29%
-2,156
-63.99%
3,369
Rio Grande
2,478
44.79%
2,918
52.74%
137
2.47%
-440
-7.95%
5,533
Routt
7,547
56.67%
5,469
41.07%
301
2.26%
2,078
15.60%
13,317
Saguache
1,865
63.61%
964
32.88%
103
3.51%
901
30.73%
2,932
San Juan
266
52.57%
212
41.90%
28
5.53%
54
10.67%
506
San Miguel
2,992
70.30%
1,154
27.11%
110
2.59%
1,838
43.19%
4,256
Sedgwick
419
31.32%
881
65.84%
38
2.84%
-462
-34.52%
1,338
Summit
9,347
61.04%
5,571
36.38%
394
2.58%
3,776
24.66%
15,312
Teller
4,333
32.16%
8,702
64.59%
438
3.25%
-4,369
-32.43%
13,473
Washington
468
18.06%
2,076
80.12%
47
1.82%
-1,608
-62.06%
2,591
Weld
49,050
42.18%
63,775
54.84%
3,466
2.98%
-14,725
-12.66%
116,291
Yuma
987
21.56%
3,490
76.25%
100
2.19%
-2,503
-54.69%
4,577
Total
1,323,102
51.45%
1,185,243
46.09%
63,501
2.47%
137,859
5.36%
2,571,846
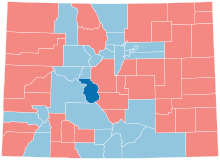
County Flips: Democratic Hold Gain from Republican Republican Hold
Counties that flipped from Republican to Democratic By congressional district
Obama won 4 of 7 congressional districts including one held by a Republican.
See also
References
"Election Results 2012" (PDF). sos.state.co.us . Retrieved July 14, 2020."2012 General Election" . Colorado Department of State. Retrieved November 22, 2012."2012 - Colorado: Romney vs. Obama | RealClearPolitics" ."Pundit accountability: The official 2012 election prediction thread - The Washington Post" . The Washington Post "2012 - Colorado: Romney vs. Obama | RealClearPolitics" ."Huffington Post Election Dashboard" . HuffPost the original on August 13, 2013."America's Choice 2012 Election Center: CNN Electoral Map" . CNN the original on January 19, 2013."Election 2012 - The Electoral Map: Building a Path to Victory" . The New York Times the original on July 8, 2012."2012 Presidential Election Results" . The Washington Post . Archived from the original on July 26, 2012."RealClearPolitics - 2012 Election Maps - Battle for White House" . Archived from the original on June 8, 2011."PROJECTION: OBAMA WILL LIKELY WIN SECOND TERM" ."Nate Silver's political calculations predict 2012 election outcome" ."Daily Kos Elections' statewide election results by congressional and legislative districts" .
External links
(2011 ← ) 2012 United States elections (→ 2013 ) U.S.
U.S.
U.S. Election )
Governors
Attorneys
Other
State
Alaska
Arizona
California
Connecticut
Delaware
Florida
Hawaii
Illinois
Iowa
Michigan
Minnesota
Montana
New Mexico
New York
North Carolina
Oregon
Pennsylvania
Texas
Washington
Wisconsin
Wyoming
Mayoral
Alexandria, VA Anchorage, AK Augusta, GA Austin, TX Bakersfield, CA Baton Rouge, LA Cheyenne, WY Corpus Christi, TX Fort Lauderdale, FL Fresno, CA Glendale, AZ Honolulu, HI Huntsville, AL Irvine, CA Juneau, AK Lubbock, TX Mesa, AZ Miami-Dade County, FL Milwaukee, WI Orlando, FL Portland, OR Richmond, VA Riverside, CA Sacramento, CA San Diego, CA San Juan, PR Santa Ana, CA Stockton, CA Virginia Beach, VA Wilmington, DE States and
Categories :
Text is available under the Creative Commons Attribution-ShareAlike License. Additional terms may apply.
**DISCLAIMER** We are not affiliated with Wikipedia, and Cloudflare.
The information presented on this site is for general informational purposes only and does not constitute medical advice.
You should always have a personal consultation with a healthcare professional before making changes to your diet, medication, or exercise routine.
AI helps with the correspondence in our chat.
We participate in an affiliate program. If you buy something through a link, we may earn a commission 💕
↑
 County results


