Main article: 1948 United States presidential election
1948 United States presidential election in Colorado Colorado votes to the Electoral College
Truman
40–50%
50–60%
60–70%
Dewey
40–50%
50–60%
60–70%
The 1948 United States presidential election in Colorado took place on November 2, 1948, as part of the 1948 United States presidential election . State voters chose six representatives, or electors, to the Electoral College , who voted for president and vice president .
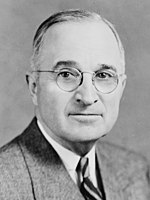
Colorado was won by incumbent President Harry S. Truman (D –Missouri ), running with Senator Alben W. Barkley , with 51.88% of the popular vote, against Governor Thomas E. Dewey (R –New York ), running with Governor Earl Warren , with 46.52% of the popular vote. As of the 2020 election , Truman remains the last candidate to carry Colorado without winning Larimer County , as well as the last Democrat to win the national election without Adams County . Colorado also marks Truman's strongest performance in a state that Dewey had won against Franklin D. Roosevelt in 1944 .
Results
Results by county
County
Harry S. Truman
Thomas E. Dewey
Henry A. Wallace
Various candidates
Margin
Total votes cast
#
%
#
%
#
%
#
%
#
%
Adams
4,419
40.95%
6,240
57.83%
99
0.92%
33
0.31%
-1,821
-16.88%
10,791
Alamosa
2,395
54.76%
1,950
44.58%
24
0.55%
5
0.11%
445
10.18%
4,374
Arapahoe
6,962
46.17%
7,943
52.67%
122
0.81%
53
0.35%
-981
-6.50%
15,080
Archuleta
479
44.19%
597
55.07%
4
0.37%
4
0.37%
-118
-10.88%
1,084
Baca
1,398
52.13%
1,260
46.98%
21
0.78%
3
0.11%
138
5.15%
2,682
Bent
1,658
55.56%
1,296
43.43%
18
0.60%
12
0.40%
362
12.13%
2,984
Boulder
8,792
44.32%
10,335
52.09%
488
2.46%
224
1.13%
-1,543
-7.77%
19,839
Chaffee
1,476
41.23%
2,065
57.68%
31
0.87%
8
0.22%
-589
-16.45%
3,580
Cheyenne
713
51.44%
657
47.40%
13
0.94%
3
0.22%
56
4.04%
1,386
Clear Creek
836
50.24%
810
48.68%
12
0.72%
6
0.36%
26
1.56%
1,664
Conejos
2,236
58.43%
1,532
40.03%
25
0.65%
34
0.89%
704
18.40%
3,827
Costilla
1,563
61.73%
921
36.37%
19
0.75%
29
1.15%
642
25.36%
2,532
Crowley
1,004
49.22%
1,027
50.34%
4
0.20%
5
0.25%
-23
-1.12%
2,040
Custer
384
40.72%
547
58.01%
10
1.06%
2
0.21%
-163
-17.29%
943
Delta
3,171
49.02%
3,158
48.82%
117
1.81%
23
0.36%
13
0.20%
6,469
Denver
89,489
52.93%
76,364
45.17%
2,420
1.43%
794
0.47%
13,125
7.76%
169,067
Dolores
435
54.31%
352
43.95%
14
1.75%
0
0.00%
83
10.36%
801
Douglas
767
43.68%
979
55.75%
5
0.28%
5
0.28%
-212
-12.07%
1,756
Eagle
1,008
55.05%
738
40.31%
80
4.37%
5
0.27%
270
14.74%
1,831
El Paso
12,291
43.25%
15,705
55.26%
258
0.91%
165
0.58%
-3,414
-12.01%
28,419
Elbert
873
42.61%
1,155
56.37%
19
0.93%
2
0.10%
-282
-13.76%
2,049
Fremont
4,077
47.26%
4,421
51.25%
95
1.10%
34
0.39%
-344
-3.99%
8,627
Garfield
2,364
49.03%
2,416
50.10%
37
0.77%
5
0.10%
-52
-1.07%
4,822
Gilpin
296
48.45%
302
49.43%
10
1.64%
3
0.49%
-6
-0.98%
611
Grand
763
48.85%
777
49.74%
12
0.77%
10
0.64%
-14
-0.89%
1,562
Gunnison
1,326
53.17%
1,103
44.23%
56
2.25%
9
0.36%
223
8.94%
2,494
Hinsdale
75
36.06%
133
63.94%
0
0.00%
0
0.00%
-58
-27.88%
208
Huerfano
3,448
63.73%
1,841
34.03%
115
2.13%
6
0.11%
1,607
29.70%
5,410
Jackson
291
47.09%
327
52.91%
0
0.00%
0
0.00%
-36
-5.82%
618
Jefferson
9,145
47.36%
9,903
51.29%
179
0.93%
81
0.42%
-758
-3.93%
19,308
Kiowa
659
46.05%
758
52.97%
11
0.77%
3
0.21%
-99
-6.92%
1,431
Kit Carson
1,281
40.27%
1,873
58.88%
17
0.53%
10
0.31%
-592
-18.61%
3,181
La Plata
2,536
47.37%
2,735
51.08%
75
1.40%
8
0.15%
-199
-3.71%
5,354
Lake
1,581
63.04%
838
33.41%
78
3.11%
11
0.44%
743
29.63%
2,508
Larimer
7,062
41.47%
9,813
57.63%
83
0.49%
71
0.42%
-2,751
-16.16%
17,029
Las Animas
7,586
67.67%
3,452
30.79%
133
1.19%
39
0.35%
4,134
36.88%
11,210
Lincoln
1,231
48.93%
1,271
50.52%
10
0.40%
4
0.16%
-40
-1.59%
2,516
Logan
3,179
49.30%
3,223
49.98%
33
0.51%
13
0.20%
-44
-0.68%
6,448
Mesa
8,401
55.32%
6,586
43.37%
137
0.90%
61
0.40%
1,815
11.95%
15,185
Mineral
190
56.72%
144
42.99%
1
0.30%
0
0.00%
46
13.73%
335
Moffat
1,101
46.05%
1,261
52.74%
23
0.96%
6
0.25%
-160
-6.69%
2,391
Montezuma
1,653
49.89%
1,630
49.20%
21
0.63%
9
0.27%
23
0.69%
3,313
Montrose
2,544
49.73%
2,473
48.34%
70
1.37%
29
0.57%
71
1.39%
5,116
Morgan
2,912
45.63%
3,417
53.54%
39
0.61%
14
0.22%
-505
-7.91%
6,382
Otero
8,640
66.30%
4,311
33.08%
61
0.47%
20
0.15%
4,329
33.22%
13,032
Ouray
461
44.11%
574
54.93%
7
0.67%
3
0.29%
-113
-10.82%
1,045
Park
505
43.84%
637
55.30%
9
0.78%
1
0.09%
-132
-11.46%
1,152
Phillips
932
45.49%
1,076
52.51%
32
1.56%
9
0.44%
-144
-7.02%
2,049
Pitkin
409
54.46%
319
42.48%
21
2.80%
2
0.27%
90
11.98%
751
Prowers
2,497
49.47%
2,505
49.63%
22
0.44%
23
0.46%
-8
-0.16%
5,047
Pueblo
21,637
61.75%
12,756
36.40%
572
1.63%
76
0.22%
8,881
25.35%
35,041
Rio Blanco
752
42.95%
981
56.03%
17
0.97%
1
0.06%
-229
-13.08%
1,751
Rio Grande
1,814
46.80%
2,049
52.86%
6
0.15%
7
0.18%
-235
-6.06%
3,876
Routt
2,088
57.19%
1,492
40.87%
56
1.53%
15
0.41%
596
16.32%
3,651
Saguache
1,009
52.09%
914
47.19%
10
0.52%
4
0.21%
95
4.90%
1,937
San Juan
348
49.71%
329
47.00%
21
3.00%
2
0.29%
19
2.71%
700
San Miguel
613
56.81%
451
41.80%
15
1.39%
0
0.00%
162
15.01%
1,079
Sedgwick
834
44.67%
1,020
54.63%
10
0.54%
3
0.16%
-186
-9.96%
1,867
Summit
378
56.00%
292
43.26%
3
0.44%
2
0.30%
86
12.74%
675
Teller
779
50.36%
748
48.35%
16
1.03%
4
0.26%
31
2.01%
1,547
Washington
1,308
44.16%
1,636
55.23%
11
0.24%
7
0.24%
-328
-11.07%
2,962
Weld
10,934
46.25%
12,446
52.65%
171
0.72%
88
0.37%
-1,512
-6.40%
23,639
Yuma
1,907
45.26%
2,277
54.05%
17
0.40%
12
0.28%
-370
-8.79%
4,213
Total
267,288
51.88%
239,714
46.52%
6,115
1.19%
2,120
0.41%
27,574
5.36%
515,237
Counties that flipped from Democratic to Republican
Counties that flipped from Republican to Democratic
See also
References
"United States Presidential election of 1948 - Encyclopædia Britannica" . Retrieved October 25, 2017."1948 Election for the Forty-First Term (1949-53)" . Retrieved October 25, 2017."1948 Presidential General Election Results - Colorado" . Retrieved October 25, 2017."The American Presidency Project - Election of 1948" . Retrieved October 25, 2017.
Categories :
Text is available under the Creative Commons Attribution-ShareAlike License. Additional terms may apply.
**DISCLAIMER** We are not affiliated with Wikipedia, and Cloudflare.
The information presented on this site is for general informational purposes only and does not constitute medical advice.
You should always have a personal consultation with a healthcare professional before making changes to your diet, medication, or exercise routine.
AI helps with the correspondence in our chat.
We participate in an affiliate program. If you buy something through a link, we may earn a commission 💕
↑
 County Results


