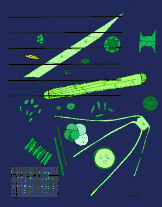
A marine food web is a food web of marine life. At the base of the ocean food web are single-celled algae and other plant-like organisms known as phytoplankton. The second trophic level (primary consumers) is occupied by zooplankton which feed off the phytoplankton. Higher order consumers complete the web. There has been increasing recognition in recent years that marine microorganisms.
Habitats lead to variations in food webs. Networks of trophic interactions can also provide a lot of information about the functioning of marine ecosystems.
Compared to terrestrial environments, marine environments have biomass pyramids which are inverted at the base. In particular, the biomass of consumers (copepods, krill, shrimp, forage fish) is larger than the biomass of primary producers. This happens because the ocean's primary producers are tiny phytoplankton which grow and reproduce rapidly, so a small mass can have a fast rate of primary production. In contrast, many significant terrestrial primary producers, such as mature forests, grow and reproduce slowly, so a much larger mass is needed to achieve the same rate of primary production. Because of this inversion, it is the zooplankton that make up most of the marine animal biomass.
| Part of a series of overviews on |
| Marine life |
|---|
 |
Food chains and trophic levels
| marine food chain (typical) |
|---|
|
|
| ↓ |
| phytoplankton |
| ↓ |
| herbivorous zooplankton |
| ↓ |
| carnivorous zooplankton |
| ↓ |
|
|
| ↓ |
|
|
Food webs are built from food chains. All forms of life in the sea have the potential to become food for another life form. In the ocean, a food chain typically starts with energy from the sun powering phytoplankton, and follows a course such as:
phytoplankton → herbivorous zooplankton → carnivorous zooplankton → filter feeder → predatory vertebrate
Phytoplankton don't need other organisms for food, because they have the ability to manufacture their own food directly from inorganic carbon, using sunlight as their energy source. This process is called photosynthesis, and results in the phytoplankton converting naturally occurring carbon into protoplasm. For this reason, phytoplankton are said to be the primary producers at the bottom or the first level of the marine food chain. Since they are at the first level they are said to have a trophic level of 1 (from the Greek trophē meaning food). Phytoplankton are then consumed at the next trophic level in the food chain by microscopic animals called zooplankton.
Zooplankton constitute the second trophic level in the food chain, and include microscopic one-celled organisms called protozoa as well as small crustaceans, such as copepods and krill, and the larva of fish, squid, lobsters and crabs. Organisms at this level can be thought of as primary consumers.
In turn, the smaller herbivorous zooplankton are consumed by larger carnivorous zooplankters, such as larger predatory protozoa and krill, and by forage fish, which are small, schooling, filter-feeding fish. This makes up the third trophic level in the food chain.

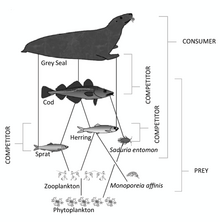
The fourth trophic level consists of predatory fish, marine mammals and seabirds that consume forage fish. Examples are swordfish, seals and gannets.
Apex predators, such as orcas, which can consume seals, and shortfin mako sharks, which can consume swordfish, make up a fifth trophic level. Baleen whales can consume zooplankton and krill directly, leading to a food chain with only three or four trophic levels.
In practice, trophic levels are not usually simple integers because the same consumer species often feeds across more than one trophic level. For example, a large marine vertebrate may eat smaller predatory fish but may also eat filter feeders; the stingray eats crustaceans, but the hammerhead eats both crustaceans and stingrays. Animals can also eat each other; the cod eats smaller cod as well as crayfish, and crayfish eat cod larvae. The feeding habits of a juvenile animal, and, as a consequence, its trophic level, can change as it grows up.
The fisheries scientist Daniel Pauly sets the values of trophic levels to one in primary producers and detritus, two in herbivores and detritivores (primary consumers), three in secondary consumers, and so on. The definition of the trophic level, TL, for any consumer species is
where is the fractional trophic level of the prey j, and represents the fraction of j in the diet of i. In the case of marine ecosystems, the trophic level of most fish and other marine consumers takes value between 2.0 and 5.0. The upper value, 5.0, is unusual, even for large fish, though it occurs in apex predators of marine mammals, such as polar bears and killer whales. As a point of contrast, humans have a mean trophic level of about 2.21, about the same as a pig or an anchovy.
By taxon
Primary producers
At the base of the ocean food web are single-celled algae and other plant-like organisms known as phytoplankton. Phytoplankton are a group of microscopic autotrophs divided into a diverse assemblage of taxonomic groups based on morphology, size, and pigment type. Marine phytoplankton mostly inhabit sunlit surface waters as photoautotrophs, and require nutrients such as nitrogen and phosphorus, as well as sunlight to fix carbon and produce oxygen. However, some marine phytoplankton inhabit the deep sea, often near deep sea vents, as chemoautotrophs which use inorganic electron sources such as hydrogen sulfide, ferrous iron and ammonia.
An ecosystem cannot be understood without knowledge of how its food web determines the flow of materials and energy. Phytoplankton autotrophically produces biomass by converting inorganic compounds into organic ones. In this way, phytoplankton functions as the foundation of the marine food web by supporting all other life in the ocean. The second central process in the marine food web is the microbial loop. This loop degrades marine bacteria and archaea, remineralises organic and inorganic matter, and then recycles the products either within the pelagic food web or by depositing them as marine sediment on the seafloor.
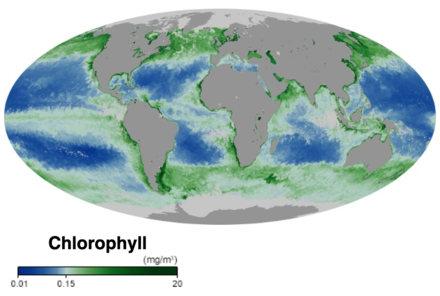
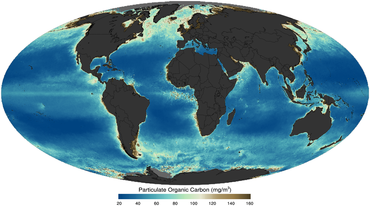
Marine phytoplankton form the basis of the marine food web, account for approximately half of global carbon fixation and oxygen production by photosynthesis and are a key link in the global carbon cycle. Like plants on land, phytoplankton use chlorophyll and other light-harvesting pigments to carry out photosynthesis, absorbing atmospheric carbon dioxide to produce sugars for fuel. Chlorophyll in the water changes the way the water reflects and absorbs sunlight, allowing scientists to map the amount and location of phytoplankton. These measurements give scientists valuable insights into the health of the ocean environment, and help scientists study the ocean carbon cycle.
If phytoplankton dies before it is eaten, it descends through the euphotic zone as part of the marine snow and settles into the depths of sea. In this way, phytoplankton sequester about 2 billion tons of carbon dioxide into the ocean each year, causing the ocean to become a sink of carbon dioxide holding about 90% of all sequestered carbon. The ocean produces about half of the world's oxygen and stores 50 times more carbon dioxide than the atmosphere.
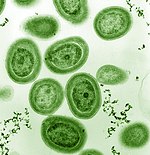
Among the phytoplankton are members from a phylum of bacteria called cyanobacteria. Marine cyanobacteria include the smallest known photosynthetic organisms. The smallest of all, Prochlorococcus, is just 0.5 to 0.8 micrometres across. In terms of individual numbers, Prochlorococcus is possibly the most plentiful species on Earth: a single millilitre of surface seawater can contain 100,000 cells or more. Worldwide there are estimated to be several octillion (10) individuals. Prochlorococcus is ubiquitous between 40°N and 40°S and dominates in the oligotrophic (nutrient poor) regions of the oceans. The bacterium accounts for about 20% of the oxygen in the Earth's atmosphere.
In oceans, most primary production is performed by algae. This is a contrast to on land, where most primary production is performed by vascular plants. Algae ranges from single floating cells to attached seaweeds, while vascular plants are represented in the ocean by groups such as the seagrasses and the mangroves. Larger producers, such as seagrasses and seaweeds, are mostly confined to the littoral zone and shallow waters, where they attach to the underlying substrate and are still within the photic zone. But most of the primary production by algae is performed by the phytoplankton.
Thus, in ocean environments, the first bottom trophic level is occupied principally by phytoplankton, microscopic drifting organisms, mostly one-celled algae, that float in the sea. Most phytoplankton are too small to be seen individually with the unaided eye. They can appear as a (often green) discoloration of the water when they are present in high enough numbers. Since they increase their biomass mostly through photosynthesis they live in the sun-lit surface layer (euphotic zone) of the sea.
The most important groups of phytoplankton include the diatoms and dinoflagellates. Diatoms are especially important in oceans, where according to some estimates they contribute up to 45% of the total ocean's primary production. Diatoms are usually microscopic, although some species can reach up to 2 millimetres in length.
Primary consumers
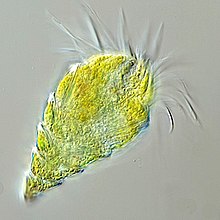
The second trophic level (primary consumers) is occupied by zooplankton which feed off the phytoplankton. Together with the phytoplankton, they form the base of the food pyramid that supports most of the world's great fishing grounds. Many zooplankton are tiny animals found with the phytoplankton in oceanic surface waters, and include tiny crustaceans, and fish larvae and fry (recently hatched fish). Most zooplankton are filter feeders, and they use appendages to strain the phytoplankton in the water. Some larger zooplankton also feed on smaller zooplankton. Some zooplankton can jump about a bit to avoid predators, but they can't really swim. Like phytoplankton, they float with the currents, tides and winds instead. Zooplankton can reproduce rapidly, their populations can increase up to thirty per cent a day under favourable conditions. Many live short and productive lives and reach maturity quickly.
The oligotrichs are a group of ciliates which have prominent oral cilia arranged like a collar and lapel. They are very common in marine plankton communities, usually found in concentrations of about one per millilitre. They are the most important herbivores in the sea, the first link in the food chain.
Other particularly important groups of zooplankton are the copepods and krill. Copepods are a group of small crustaceans found in ocean and freshwater habitats. They are the biggest source of protein in the sea, and are important prey for forage fish. Krill constitute the next biggest source of protein. Krill are particularly large predator zooplankton which feed on smaller zooplankton. This means they really belong to the third trophic level, secondary consumers, along with the forage fish.
- Zooplankton form a second level in the ocean food chain
-
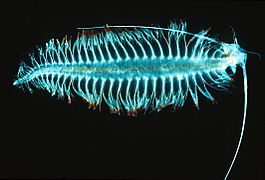 Segmented worm
-
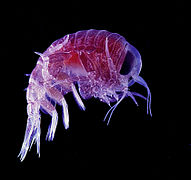 Tiny shrimp-like crustaceans
-
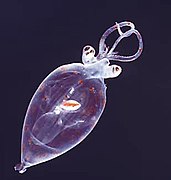 Juvenile planktonic squid

Together, phytoplankton and zooplankton make up most of the plankton in the sea. Plankton is the term applied to any small drifting organisms that float in the sea (Greek planktos = wanderer or drifter). By definition, organisms classified as plankton are unable to swim against ocean currents; they cannot resist the ambient current and control their position. In ocean environments, the first two trophic levels are occupied mainly by plankton. Plankton can be divided into producers and consumers. The producers are the phytoplankton (Greek phyton = plant) and the consumers, who eat the phytoplankton, are the zooplankton (Greek zoon = animal).
Jellyfish are slow swimmers, and most species form part of the plankton. Traditionally, jellyfish have been viewed as trophic dead ends. With body plans largely based on water, they were typically considered to have a limited impact on marine ecosystems, attracting the attention of specialized predators such as the ocean sunfish and the leatherback sea turtle. That view has recently been challenged. Jellyfish, and more generally gelatinous zooplankton which include salps and ctenophores, are very diverse, fragile with no hard parts, difficult to see and monitor, subject to rapid population swings and often live inconveniently far from shore or deep in the ocean. It is difficult for scientists to detect and analyse jellyfish in the guts of predators, since they turn to mush when eaten and are rapidly digested. But jellyfish bloom in vast numbers, and it has been shown they form major components in the diets of tuna, spearfish and swordfish as well as various birds and invertebrates such as octopus, sea cucumbers, crabs and amphipods. "Despite their low energy density, the contribution of jellyfish to the energy budgets of predators may be much greater than assumed because of rapid digestion, low capture costs, availability, and selective feeding on the more energy-rich components. Feeding on jellyfish may make marine predators susceptible to ingestion of plastics."
Higher order consumers
- Marine invertebrates
- Fish
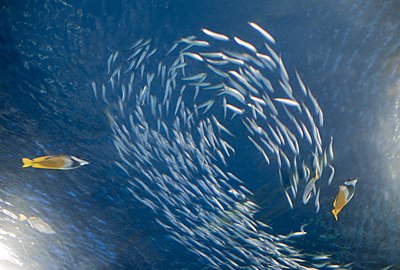
- Forage fish: Forage fish occupy central positions in the ocean food webs. The organisms it eats are at a lower trophic level, and the organisms that eat it are at a higher trophic level. Forage fish occupy middle levels in the food web, serving as a dominant prey to higher level fish, seabirds and mammals.
- Predator fish
- Ground fish
- Other marine vertebrates
In 2010, researchers found whales carry nutrients from the depths of the ocean back to the surface using a process they called the whale pump. Whales feed at deeper levels in the ocean where krill is found, but return regularly to the surface to breathe. There whales defecate a liquid rich in nitrogen and iron. Instead of sinking, the liquid stays at the surface where phytoplankton consume it. In the Gulf of Maine, the whale pump provides more nitrogen than the rivers.
-
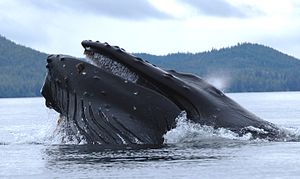
 Humpback whales lunge from below to feed on forage fish
-
 Gannets plunge dive from above to catch forage fish
-
 Whale pump nutrient cycle
Microorganisms

There has been increasing recognition in recent years that marine microorganisms play much bigger roles in marine ecosystems than was previously thought. Developments in metagenomics gives researchers an ability to reveal previously hidden diversities of microscopic life, offering a powerful lens for viewing the microbial world and the potential to revolutionise understanding of the living world. Metabarcoding dietary analysis techniques are being used to reconstruct food webs at higher levels of taxonomic resolution and are revealing deeper complexities in the web of interactions.
Microorganisms play key roles in marine food webs. The viral shunt pathway is a mechanism that prevents marine microbial particulate organic matter (POM) from migrating up trophic levels by recycling them into dissolved organic matter (DOM), which can be readily taken up by microorganisms. Viral shunting helps maintain diversity within the microbial ecosystem by preventing a single species of marine microbe from dominating the micro-environment. The DOM recycled by the viral shunt pathway is comparable to the amount generated by the other main sources of marine DOM.
In general, dissolved organic carbon (DOC) is introduced into the ocean environment from bacterial lysis, the leakage or exudation of fixed carbon from phytoplankton (e.g., mucilaginous exopolymer from diatoms), sudden cell senescence, sloppy feeding by zooplankton, the excretion of waste products by aquatic animals, or the breakdown or dissolution of organic particles from terrestrial plants and soils. Bacteria in the microbial loop decompose this particulate detritus to utilize this energy-rich matter for growth. Since more than 95% of organic matter in marine ecosystems consists of polymeric, high molecular weight (HMW) compounds (e.g., protein, polysaccharides, lipids), only a small portion of total dissolved organic matter (DOM) is readily utilizable to most marine organisms at higher trophic levels. This means that dissolved organic carbon is not available directly to most marine organisms; marine bacteria introduce this organic carbon into the food web, resulting in additional energy becoming available to higher trophic levels.
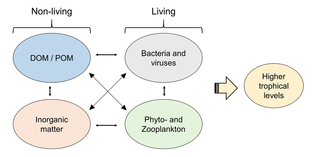 Connections between the different compartments of the living (bacteria/viruses and phyto−/zooplankton) and the nonliving (DOM/POM and inorganic matter) environment
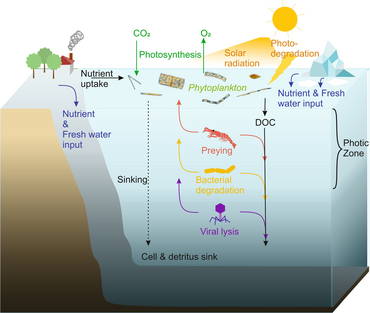
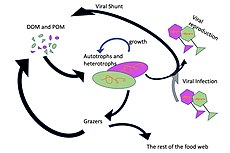 The viral shunt pathway facilitates the flow of dissolved organic matter (DOM) and particulate organic matter (POM) through the marine food web
 The giant virus CroV can attack C.roenbergensis (scale bar is 200 nm)
 Cafeteria roenbergensis is a bacterivorous marine flagellate
 A Mavirus virophage (lower left) lurking alongside a giant CroV
- Viruses
Viruses are the "most abundant biological entities on the planet", particularly in the oceans which occupy over 70% of the Earth's surface. The realisation in 1989 that there are typically about 100 marine viruses in every millilitre of seawater gave impetus to understand their diversity and role in the marine environment. Viruses are now considered to play key roles in marine ecosystems by controlling microbial community dynamics, host metabolic status, and biogeochemical cycling via lysis of hosts.
A giant marine virus CroV infects and causes the death by lysis of the marine zooflagellate Cafeteria roenbergensis. This impacts coastal ecology because Cafeteria roenbergensis feeds on bacteria found in the water. When there are low numbers of Cafeteria roenbergensis due to extensive CroV infections, the bacterial populations rise exponentially. The impact of CroV on natural populations of C. roenbergensis remains unknown; however, the virus has been found to be very host specific, and does not infect other closely related organisms. Cafeteria roenbergensis is also infected by a second virus, the Mavirus virophage, which is a satellite virus, meaning it is able to replicate only in the presence of another specific virus, in this case in the presence of CroV. This virus interferes with the replication of CroV, which leads to the survival of C. roenbergensis cells. Mavirus is able to integrate into the genome of cells of C. roenbergensis, and thereby confer immunity to the population.
Fungi
Main article: Marine fungiParasitic chytrids can transfer material from large inedible phytoplankton to zooplankton. Chytrids zoospores are excellent food for zooplankton in terms of size (2–5 μm in diameter), shape, nutritional quality (rich in polyunsaturated fatty acids and cholesterols). Large colonies of host phytoplankton may also be fragmented by chytrid infections and become edible to zooplankton.
-
 Diagram of a mycoloop (fungus loop)
-
 Roles of fungi in the marine carbon cycle by processing phytoplankton-derived organic matter
Parasitic fungi, as well as saprotrophic fungi, directly assimilate phytoplankton organic carbon. By releasing zoospores, the fungi bridge the trophic linkage to zooplankton, known as the mycoloop. By modifying the particulate and dissolved organic carbon, they can affect bacteria and the microbial loop. These processes may modify marine snow chemical composition and the subsequent functioning of the biological carbon pump.
By habitat
Pelagic webs

For pelagic ecosystems, Legendre and Rassoulzadagan proposed in 1995 a continuum of trophic pathways with the herbivorous food-chain and microbial loop as food-web end members. The classical linear food-chain end-member involves grazing by zooplankton on larger phytoplankton and subsequent predation on zooplankton by either larger zooplankton or another predator. In such a linear food-chain a predator can either lead to high phytoplankton biomass (in a system with phytoplankton, herbivore and a predator) or reduced phytoplankton biomass (in a system with four levels). Changes in predator abundance can, thus, lead to trophic cascades. The microbial loop end-member involves not only phytoplankton, as basal resource, but also dissolved organic carbon. Dissolved organic carbon is used by heterotrophic bacteria for growth are predated upon by larger zooplankton. Consequently, dissolved organic carbon is transformed, via a bacterial-microzooplankton loop, to zooplankton. These two end-member carbon processing pathways are connected at multiple levels. Small phytoplankton can be consumed directly by microzooplankton.
As illustrated in the diagram on the right, dissolved organic carbon is produced in multiple ways and by various organisms, both by primary producers and consumers of organic carbon. DOC release by primary producers occurs passively by leakage and actively during unbalanced growth during nutrient limitation. Another direct pathway from phytoplankton to dissolved organic pool involves viral lysis. Marine viruses are a major cause of phytoplankton mortality in the ocean, particularly in warmer, low-latitude waters. Sloppy feeding by herbivores and incomplete digestion of prey by consumers are other sources of dissolved organic carbon. Heterotrophic microbes use extracellular enzymes to solubilize particulate organic carbon and use this and other dissolved organic carbon resources for growth and maintenance. Part of the microbial heterotrophic production is used by microzooplankton; another part of the heterotrophic community is subject to intense viral lysis and this causes release of dissolved organic carbon again. The efficiency of the microbial loop depends on multiple factors but in particular on the relative importance of predation and viral lysis to the mortality of heterotrophic microbes.
- Pelagic food web
-
 Pelagic food web and the biological pump. Links among the ocean's biological pump and pelagic food web and the ability to sample these components remotely from ships, satellites, and autonomous vehicles. Light blue waters are the euphotic zone, while the darker blue waters represent the twilight zone.
- Mesopelagic food web
-
 Impact of mesopelagic species on the global carbon budget. DVM = diel vertical migration, NM = non-migration.
-
 Mesopelagic bristlemouths may be the most abundant vertebrates on the planet, though little is known about them.
-
 Gelatinous predators like this narcomedusan consume the greatest diversity of mesopelagic prey

Scientists are starting to explore in more detail the largely unknown twilight zone of the mesopelagic, 200 to 1,000 metres deep. This layer is responsible for removing about 4 billion tonnes of carbon dioxide from the atmosphere each year. The mesopelagic layer is inhabited by most of the marine fish biomass.
According to a 2017 study, narcomedusae consume the greatest diversity of mesopelagic prey, followed by physonect siphonophores, ctenophores and cephalopods. The importance of the so-called "jelly web" is only beginning to be understood, but it seems medusae, ctenophores and siphonophores can be key predators in deep pelagic food webs with ecological impacts similar to predator fish and squid. Traditionally gelatinous predators were thought ineffectual providers of marine trophic pathways, but they appear to have substantial and integral roles in deep pelagic food webs. Diel vertical migration, an important active transport mechanism, allows mesozooplankton to sequester carbon dioxide from the atmosphere as well as supply carbon needs for other mesopelagic organisms.
A 2020 study reported that by 2050 global warming could be spreading in the deep ocean seven times faster than it is now, even if emissions of greenhouse gases are cut. Warming in mesopelagic and deeper layers could have major consequences for the deep ocean food web, since ocean species will need to move to stay at survival temperatures.
- Fish in the twilight cast new light on ocean ecosystem The Conversation, 10 February 2014.
- An Ocean Mystery in the Trillions The New York Times, 29 June 2015.
- Mesopelagic fishes - Malaspina circumnavigation expedition of 2010.
At the ocean surface
See also: Ocean surface ecosystem and Sea surface microlayer
Ocean surface habitats sit at the interface between the ocean and the atmosphere. The biofilm-like habitat at the surface of the ocean harbours surface-dwelling microorganisms, commonly referred to as neuston. This vast air–water interface sits at the intersection of major air–water exchange processes spanning more than 70% of the global surface area . Bacteria in the surface microlayer of the ocean, the so-called bacterioneuston, are of interest due to practical applications such as air-sea gas exchange of greenhouse gases, production of climate-active marine aerosols, and remote sensing of the ocean. Of specific interest is the production and degradation of surfactants (surface active materials) via microbial biochemical processes. Major sources of surfactants in the open ocean include phytoplankton, terrestrial runoff, and deposition from the atmosphere.
Unlike coloured algal blooms, surfactant-associated bacteria may not be visible in ocean colour imagery. Having the ability to detect these "invisible" surfactant-associated bacteria using synthetic aperture radar has immense benefits in all-weather conditions, regardless of cloud, fog, or daylight. This is particularly important in very high winds, because these are the conditions when the most intense air-sea gas exchanges and marine aerosol production take place. Therefore, in addition to colour satellite imagery, SAR satellite imagery may provide additional insights into a global picture of biophysical processes at the boundary between the ocean and atmosphere, air-sea greenhouse gas exchanges and production of climate-active marine aerosols.
At the ocean floor

Ocean floor (benthic) habitats sit at the interface between the ocean and the interior of the Earth.
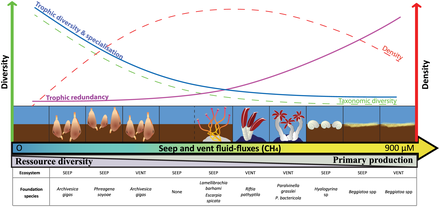
- Seeps and vents
Coastal webs
See also: Marine coastal ecosystem| This article's images may require adjustment of image placement, formatting, and size. Please see the picture tutorial and the image placement policy for further information. (February 2023) |
Coastal waters include the waters in estuaries and over continental shelves. They occupy about 8 per cent of the total ocean area and account for about half of all the ocean productivity. The key nutrients determining eutrophication are nitrogen in coastal waters and phosphorus in lakes. Both are found in high concentrations in guano (seabird feces), which acts as a fertilizer for the surrounding ocean or an adjacent lake. Uric acid is the dominant nitrogen compound, and during its mineralization different nitrogen forms are produced.
Ecosystems, even those with seemingly distinct borders, rarely function independently of other adjacent systems. Ecologists are increasingly recognizing the important effects that cross-ecosystem transport of energy and nutrients have on plant and animal populations and communities. A well known example of this is how seabirds concentrate marine-derived nutrients on breeding islands in the form of feces (guano) which contains ≈15–20% nitrogen (N), as well as 10% phosphorus. These nutrients dramatically alter terrestrial ecosystem functioning and dynamics and can support increased primary and secondary productivity. However, although many studies have demonstrated nitrogen enrichment of terrestrial components due to guano deposition across various taxonomic groups, only a few have studied its retroaction on marine ecosystems and most of these studies were restricted to temperate regions and high nutrient waters. In the tropics, coral reefs can be found adjacent to islands with large populations of breeding seabirds, and could be potentially affected by local nutrient enrichment due to the transport of seabird-derived nutrients in surrounding waters. Studies on the influence of guano on tropical marine ecosystems suggest nitrogen from guano enriches seawater and reef primary producers.
Reef building corals have essential nitrogen needs and, thriving in nutrient-poor tropical waters where nitrogen is a major limiting nutrient for primary productivity, they have developed specific adaptations for conserving this element. Their establishment and maintenance are partly due to their symbiosis with unicellular dinoflagellates, Symbiodinium spp. (zooxanthellae), that can take up and retain dissolved inorganic nitrogen (ammonium and nitrate) from the surrounding waters. These zooxanthellae can also recycle the animal wastes and subsequently transfer them back to the coral host as amino acids, ammonium or urea. Corals are also able to ingest nitrogen-rich sediment particles and plankton. Coastal eutrophication and excess nutrient supply can have strong impacts on corals, leading to a decrease in skeletal growth,
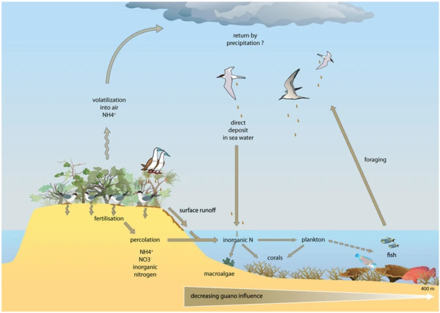
 Seabird colonies are nutrient hot spots, especially, for nitrogen and phosphorus
In the diagram above on the right: (1) ammonification produces NH3 and NH4 and (2) nitrification produces NO3 by NH4 oxidation. (3) under the alkaline conditions, typical of the seabird feces, the NH3 is rapidly volatilised and transformed to NH4, (4) which is transported out of the colony, and through wet-deposition exported to distant ecosystems, which are eutrophised. The phosphorus cycle is simpler and has reduced mobility. This element is found in a number of chemical forms in the seabird fecal material, but the most mobile and bioavailable is orthophosphate, (5) which can be leached by subterranean or superficial waters.
Filter feeding bivalves Ecosystem services provided by filter feeding bivalves often resident in estuaries, in the form of nutrient extraction from phytoplankton. Blue mussels are used in the example but other bivalves like oysters also provide these nutrient extraction services.
Estuaries
 Example food web from an estuary, the Venice Lagoon, involving 27 nodes or functional groups. Colors of flows depict different fishing target (artisanal fisheries in blue, and clam fishery in red) and non-target species (for clam harvesting, in green).
Chesapeake waterbird food web
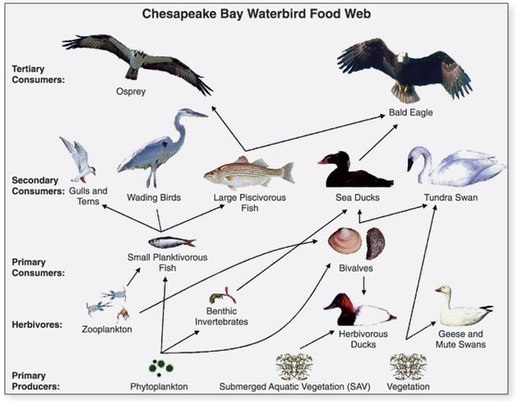 Generalized food web for some of the major waterbirds that frequent the Chesapeake Bay. Food sources and habitats of waterbirds are affected by multiple factors, including exotic and invasive species.
 Typical food web on a continental shelf
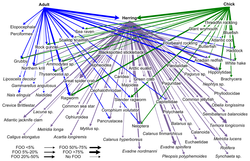 Puffin and herring food web
Coral reef
 Food web reconstruction by DNA barcodes at the coral reef of Moorea, French Polynesia. Dietary partitioning among three predatory fish species as detected using metabarcoding dietary analysis. The taxonomic resolution provided by the metabarcoding approach highlights a complex interaction web and demonstrates that levels of trophic partitioning among coral reef fishes have likely been underestimated.
Seagrass meadows
 Cumulative visualization of a number of seagrass food webs from different regions and with different eutrophication levels Different coloured dots represent trophic groups from different trophic levels with black = primary producers, dark to light grey = secondary producers, and the lightest grey being top predators. The grey links represent feeding links.
Coral reef diversity
 Taxonomic phylogram derived from ToL-metabarcoding of eukaryotic diversity around the coral reefs at Coral Bay in Australia. Bar graphs indicate the number of families in each phyla, coloured according to kingdom.
Sponge reefs
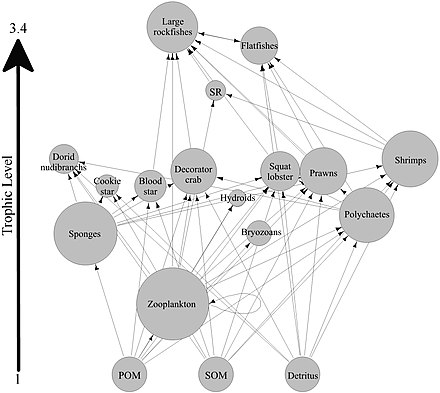 Generalised food web for sponge reefs
DNA barcoding can be used to construct food web structures with better taxonomic resolution at the web nodes. This provides more specific species identification and greater clarity about exactly who eats whom. "DNA barcodes and DNA information may allow new approaches to the construction of larger interaction webs, and overcome some hurdles to achieving adequate sample size".
A newly applied method for species identification is DNA metabarcoding. Species identification via morphology is relatively difficult and requires a lot of time and expertise. High throughput sequencing DNA metabarcoding enables taxonomic assignment and therefore identification for the complete sample regarding the group specific primers chosen for the previous DNA amplification.
- Microbial DNA barcoding
- Algae DNA barcoding
- Fish DNA barcoding
- DNA barcoding in diet assessment
- Kelp forests
- Byrnes, J.E., Reynolds, P.L. and Stachowicz, J.J. (2007) "Invasions and extinctions reshape coastal marine food webs". PLOS ONE, 2(3): e295. doi:10.1371/journal.pone.0000295
Polar webs
Polar topographies The Antarctica is a frozen landmass surrounded by oceans
 The Arctic is a frozen ocean surrounded by landmasses The annual pulse of ice and snow at the poles
Arctic and Antarctic marine systems have very different topographical structures and as a consequence have very different food web structures. Both Arctic and Antarctic pelagic food webs have characteristic energy flows controlled largely by a few key species. But there is no single generic web for either. Alternative pathways are important for resilience and maintaining energy flows. However, these more complicated alternatives provide less energy flow to upper trophic-level species. "Food-web structure may be similar in different regions, but the individual species that dominate mid-trophic levels vary across polar regions".
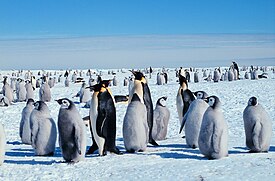 The Antarctic has penguins but no polar bears
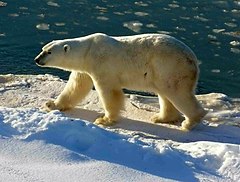 The Arctic has polar bears but no penguins
- Arctic
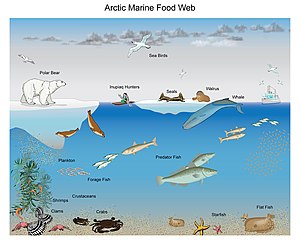 Traditional arctic marine food web with a focus on macroorganisms
 Contemporary arctic marine food web with a greater focus on the role of microorganisms
The Arctic food web is complex. The loss of sea ice can ultimately affect the entire food web, from algae and plankton to fish to mammals. The impact of climate change on a particular species can ripple through a food web and affect a wide range of other organisms... Not only is the decline of sea ice impairing polar bear populations by reducing the extent of their primary habitat, it is also negatively impacting them via food web effects. Declines in the duration and extent of sea ice in the Arctic leads to declines in the abundance of ice algae, which thrive in nutrient-rich pockets in the ice. These algae are eaten by zooplankton, which are in turn eaten by Arctic cod, an important food source for many marine mammals, including seals. Seals are eaten by polar bears. Hence, declines in ice algae can contribute to declines in polar bear populations.
In 2020 researchers reported that measurements over the last two decades on primary production in the Arctic Ocean show an increase of nearly 60% due to higher concentrations of phytoplankton. They hypothesize that new nutrients are flowing in from other oceans and suggest this means the Arctic Ocean may be able to support higher trophic level production and additional carbon fixation in the future.
 Pteropod (sea angel)
 The bacterium Marinomonas arctica grows inside Arctic sea ice at subzero temperatures
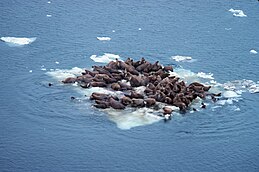 Walrus are keystone species in the Arctic but are not found in the Antarctic.
Arctic food web with mixotrophy
 Yellow arrows: flow of energy from the sun to photosynthetic organisms (autotrophs and mixotrophs)
Gray arrows: flow of carbon to heterotrophs
Green arrows: major pathways of carbon flow to or from mixotrophs
HCIL: heterotrophic ciliates; MCIL: mixotrophic ciliates; HNF: heterotrophic nanoflagellates; DOC: dissolved organic carbon; HDIN: heterotrophic dinoflagellates

- Antarctic
-
 Antarctic jellyfish Diplulmaris antarctica under the ice
-
 Colonies of the alga Phaeocystis antarctica, an important phytoplankter of the Ross Sea that dominates early season blooms after the sea ice retreats and exports significant carbon.
-
 The pennate diatom Fragilariopsis kerguelensis, found throughout the Antarctic Circumpolar Current, is a key driver of the global silicate pump.
-
 A group of killer whales attempt to dislodge a crabeater seal on an ice floe
 Processes in the biological pump. Numbers given are carbon fluxes (Gt C yr−1) in white boxes and carbon masses (Gt C) in dark boxes.
Phytoplankton convert CO2, which has dissolved from the atmosphere into the surface oceans into particulate organic carbon (POC) during primary production. Phytoplankton are then consumed by krill and small zooplankton grazers, which in turn are preyed upon by higher trophic levels. Any unconsumed phytoplankton form aggregates, and along with zooplankton faecal pellets, sink rapidly and are exported out of the mixed layer. Krill, zooplankton and microbes intercept phytoplankton in the surface ocean and sinking detrital particles at depth, consuming and respiring this POC to CO2 (dissolved inorganic carbon, DIC), such that only a small proportion of surface-produced carbon sinks to the deep ocean (i.e., depths > 1000 m). As krill and smaller zooplankton feed, they also physically fragment particles into small, slower- or non-sinking pieces (via sloppy feeding, coprorhexy if fragmenting faeces), retarding POC export. This releases dissolved organic carbon (DOC) either directly from cells or indirectly via bacterial solubilisation (yellow circle around DOC). Bacteria can then remineralise the DOC to DIC (CO2, microbial gardening). Diel vertically migrating krill, smaller zooplankton and fish can actively transport carbon to depth by consuming POC in the surface layer at night, and metabolising it at their daytime, mesopelagic residence depths. Depending on species life history, active transport may occur on a seasonal basis as well.


Polar microorganisms
In addition to the varied topographies and in spite of an extremely cold climate, polar aquatic regions are teeming with microbial life. Even in sub-glacial regions, cellular life has adapted to these extreme environments where perhaps there are traces of early microbes on Earth. As grazing by macrofauna is limited in most of these polar regions, viruses are being recognised for their role as important agents of mortality, thereby influencing the biogeochemical cycling of nutrients that, in turn, impact community dynamics at seasonal and spatial scales.
Microorganisms are at the heart of Arctic and Antarctic food webs. These polar environments contain a diverse range of bacterial, archaeal, and eukaryotic microbial communities that, along with viruses, are important components of the polar ecosystems. They are found in a range of habitats, including subglacial lakes and cryoconite holes, making the cold biomes of these polar regions replete with metabolically diverse microorganisms and sites of active biogeochemical cycling. These environments, that cover approximately one-fifth of the surface of the Earth and that are inhospitable to human life, are home to unique microbial communities. The resident microbiota of the two regions has a similarity of only about 30%—not necessarily surprising given the limited connectivity of the polar oceans and the difference in freshwater supply, coming from glacial melts and rivers that drain into the Southern Ocean and the Arctic Ocean, respectively. The separation is not just by distance: Antarctica is surrounded by the Southern Ocean that is driven by the strong Antarctic Circumpolar Current, whereas the Arctic is ringed by landmasses. Such different topographies resulted as the two continents moved to the opposite polar regions of the planet ≈40–25 million years ago. Magnetic and gravity data point to the evolution of the Arctic, driven by the Amerasian and Eurasian basins, from 145 to 161 million years ago to a cold polar region of water and ice surrounded by land. Antarctica was formed from the breakup of the super-continent, Gondwana, a landmass surrounded by the Southern Ocean. The Antarctic continent is permanently covered with glacial ice, with only 0.4% of its area comprising exposed land dotted with lakes and ponds.
Microbes, both prokaryotic and eukaryotic that are present in these environments, are largely different between the two poles. For example, 78% of bacterial operational taxonomic units (OTUs) of surface water communities of the Southern Ocean and 70% of the Arctic Ocean are unique to each pole. Polar regions are variable in time and space—analysis of the V6 region of the small subunit (SSU) rRNA gene has resulted in about 400,000 gene sequences and over 11,000 OTUs from 44 polar samples of the Arctic and the Southern Ocean. These OTUs cluster separately for the two polar regions and, additionally, exhibit significant differences in just the polar bacterioplankton communities from different environments (coastal and open ocean) and different seasons.
The polar regions are characterised by truncated food webs, and the role of viruses in ecosystem function is likely to be even greater than elsewhere in the marine food web. Their diversity is still relatively under-explored, and the way in which they affect polar communities is not well understood, particularly in nutrient cycling.
Foundation and keystone species
 The ochre starfish is a keystone predator
 California mussels displace most other species unless ochre starfish control their numbers
 The concept of a foundation species was introduced in 1972 by Paul K. Dayton, who applied it to certain members of marine invertebrate and algae communities. It was clear from studies in several locations that there were a small handful of species whose activities had a disproportionate effect on the rest of the marine community and they were therefore key to the resilience of the community. Dayton's view was that focusing on foundation species would allow for a simplified approach to more rapidly understand how a community as a whole would react to disturbances, such as pollution, instead of attempting the extremely difficult task of tracking the responses of all community members simultaneously.
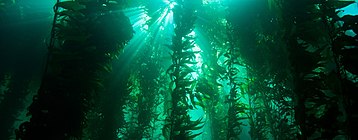
Foundation species are species that have a dominant role structuring an ecological community, shaping its environment and defining its ecosystem. Such ecosystems are often named after the foundation species, such as seagrass meadows, oyster beds, coral reefs, kelp forests and mangrove forests. For example, the red mangrove is a common foundation species in mangrove forests. The mangrove's root provides nursery grounds for young fish, such as snapper. A foundation species can occupy any trophic level in a food web but tend to be a producer.
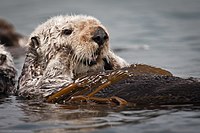 Sea otters predate sea urchins, making them a keystone species for kelp forests
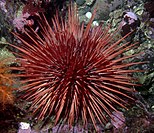 Sea urchins damage kelp forests by chewing through kelp holdfasts
 The concept of the keystone species was introduced in 1969 by the zoologist Robert T. Paine. Paine developed the concept to explain his observations and experiments on the relationships between marine invertebrates of the intertidal zone (between the high and low tide lines), including starfish and mussels. Some sea stars prey on sea urchins, mussels, and other shellfish that have no other natural predators. If the sea star is removed from the ecosystem, the mussel population explodes uncontrollably, driving out most other species.
Keystone species are species that have large effects, disproportionate to their numbers, within ecosystem food webs. An ecosystem may experience a dramatic shift if a keystone species is removed, even though that species was a small part of the ecosystem by measures of biomass or productivity. Sea otters limit the damage sea urchins inflict on kelp forests. When the sea otters of the North American west coast were hunted commercially for their fur, their numbers fell to such low levels that they were unable to control the sea urchin population. The urchins in turn grazed the holdfasts of kelp so heavily that the kelp forests largely disappeared, along with all the species that depended on them. Reintroducing the sea otters has enabled the kelp ecosystem to be restored.
Topological position
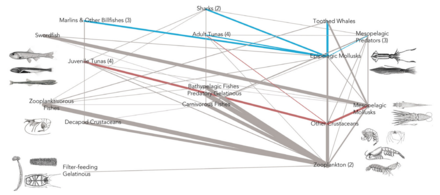
See also: Marine coastal ecosystem § Network ecologyNetworks of trophic interactions can provide a lot of information about the functioning of marine ecosystems. Beyond feeding habits, three additional traits (mobility, size, and habitat) of various organisms can complement this trophic view.

In order to sustain the proper functioning of ecosystems, there is a need to better understand the simple question asked by Lawton in 1994: What do species do in ecosystems? Since ecological roles and food web positions are not independent, the question of what kind of species occupy various of network positions needs to be asked. Since the very first attempts to identify keystone species, there has been an interest in their place in food webs. First they were suggested to have been top predators, then also plants, herbivores, and parasites. For both community ecology and conservation biology, it would be useful to know where are they in complex trophic networks.
An example of this kind of network analysis is shown in the diagram, based on data from a marine food web. It shows relationships between the topological positions of web nodes and the mobility values of the organism's involved. The web nodes are shape-coded according to their mobility, and colour-coded using indices which emphasise (A) bottom-up groups (sessile and drifters), and (B) groups at the top of the food web.
The relative importance of organisms varies with time and space, and looking at large databases may provide general insights into the problem. If different kinds of organisms occupy different types of network positions, then adjusting for this in food web modelling will result in more reliable predictions. Comparisons of centrality indices with each other (the similarity of degree centrality and closeness centrality, keystone and keystoneness indexes, and centrality indices versus trophic level (most high-centrality species at medium trophic levels) were done to better understand critically important positions of organisms in food webs. Extending this interest by adding trait data to trophic groups helps the biological interpretation of the results. Relationships between centrality indices have been studied for other network types as well, including habitat networks. With large databases and new statistical analyses, questions like these can be re-investigated and knowledge can be updated.
Cryptic interactions

Cryptic interactions, interactions which are "hidden in plain sight", occur throughout the marine planktonic foodweb but are currently largely overlooked by established methods, which mean large‐scale data collection for these interactions is limited. Despite this, current evidence suggests some of these interactions may have perceptible impacts on foodweb dynamics and model results. Incorporation of cryptic interactions into models is especially important for those interactions involving the transport of nutrients or energy.
The diagram illustrates the material fluxes, populations, and molecular pools that are impacted by five cryptic interactions: mixotrophy, ontogenetic and species differences, microbial cross‐feeding, auxotrophy and cellular carbon partitioning. These interactions may have synergistic effects as the regions of the food web that they impact overlap. For example, cellular carbon partition in phytoplankton can affect both downstream pools of organic matter utilised in microbial cross‐feeding and exchanged in cases of auxotrophy, as well as prey selection based on ontogenetic and species differences.
Simplifications such as "zooplankton consume phytoplankton", "phytoplankton take up inorganic nutrients", "gross primary production determines the amount of carbon available to the food web", etc. have helped scientists explain and model general interactions in the aquatic environment. Traditional methods have focused on quantifying and qualifying these generalisations, but rapid advancements in genomics, sensor detection limits, experimental methods, and other technologies in recent years have shown that generalisation of interactions within the plankton community may be too simple. These enhancements in technology have exposed a number of interactions which appear as cryptic because bulk sampling efforts and experimental methods are biased against them.
Complexity and stability
See also: Ecological complexity and Ecological stability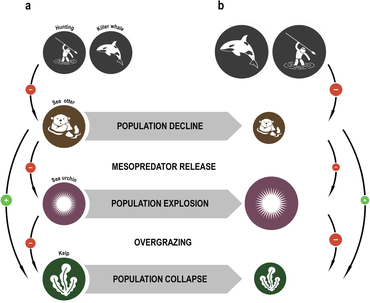
Food webs provide a framework within which a complex network of predator–prey interactions can be organised. A food web model is a network of food chains. Each food chain starts with a primary producer or autotroph, an organism, such as an alga or a plant, which is able to manufacture its own food. Next in the chain is an organism that feeds on the primary producer, and the chain continues in this way as a string of successive predators. The organisms in each chain are grouped into trophic levels, based on how many links they are removed from the primary producers. The length of the chain, or trophic level, is a measure of the number of species encountered as energy or nutrients move from plants to top predators. Food energy flows from one organism to the next and to the next and so on, with some energy being lost at each level. At a given trophic level there may be one species or a group of species with the same predators and prey.
In 1927, Charles Elton published an influential synthesis on the use of food webs, which resulted in them becoming a central concept in ecology. In 1966, interest in food webs increased after Robert Paine's experimental and descriptive study of intertidal shores, suggesting that food web complexity was key to maintaining species diversity and ecological stability. Many theoretical ecologists, including Robert May and Stuart Pimm, were prompted by this discovery and others to examine the mathematical properties of food webs. According to their analyses, complex food webs should be less stable than simple food webs. The apparent paradox between the complexity of food webs observed in nature and the mathematical fragility of food web models is currently an area of intensive study and debate. The paradox may be due partially to conceptual differences between persistence of a food web and equilibrial stability of a food web.
A trophic cascade can occur in a food web if a trophic level in the web is suppressed.
For example, a top-down cascade can occur if predators are effective enough in predation to reduce the abundance, or alter the behavior, of their prey, thereby releasing the next lower trophic level from predation. A top-down cascade is a trophic cascade where the top consumer/predator controls the primary consumer population. In turn, the primary producer population thrives. The removal of the top predator can alter the food web dynamics. In this case, the primary consumers would overpopulate and exploit the primary producers. Eventually there would not be enough primary producers to sustain the consumer population. Top-down food web stability depends on competition and predation in the higher trophic levels. Invasive species can also alter this cascade by removing or becoming a top predator. This interaction may not always be negative. Studies have shown that certain invasive species have begun to shift cascades; and as a consequence, ecosystem degradation has been repaired. An example of a cascade in a complex, open-ocean ecosystem occurred in the northwest Atlantic during the 1980s and 1990s. The removal of Atlantic cod (Gadus morhua) and other ground fishes by sustained overfishing resulted in increases in the abundance of the prey species for these ground fishes, particularly smaller forage fishes and invertebrates such as the northern snow crab (Chionoecetes opilio) and northern shrimp (Pandalus borealis). The increased abundance of these prey species altered the community of zooplankton that serve as food for smaller fishes and invertebrates as an indirect effect. Top-down cascades can be important for understanding the knock-on effects of removing top predators from food webs, as humans have done in many places through hunting and fishing.
In a bottom-up cascade, the population of primary producers will always control the increase/decrease of the energy in the higher trophic levels. Primary producers are plants, phytoplankton and zooplankton that require photosynthesis. Although light is important, primary producer populations are altered by the amount of nutrients in the system. This food web relies on the availability and limitation of resources. All populations will experience growth if there is initially a large amount of nutrients.
Terrestrial comparisons

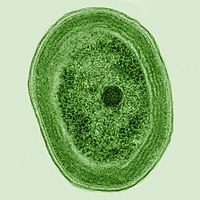 The minute but ubiquitous and highly active bacterium Prochlorococcus runs through its life cycle in one day, yet collectively generates about 20% of all global oxygen.
 By contrast, a single bristlecone pine can tie up a lot of relatively inert biomass for thousands of years with little photosynthetic activity.
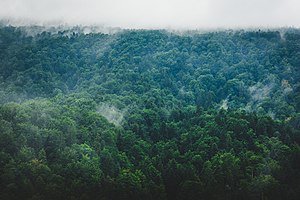
Marine environments can have inversions in their biomass pyramids. In particular, the biomass of consumers (copepods, krill, shrimp, forage fish) is generally larger than the biomass of primary producers. Because of this inversion, it is the zooplankton that make up most of the marine animal biomass. As primary consumers, zooplankton are the crucial link between the primary producers (mainly phytoplankton) and the rest of the marine food web (secondary consumers); the ocean's primary producers are mostly tiny phytoplankton which have r-strategist traits of growing and reproducing rapidly, so a small mass can have a fast rate of primary production.
In contrast, many terrestrial primary producers, such as mature forests, have K-strategist traits of growing and reproducing slowly, so a much larger mass is needed to achieve the same rate of primary production. The rate of production divided by the average amount of biomass that achieves it is known as an organism's Production/Biomass (P/B) ratio. Production is measured in terms of the amount of movement of mass or energy per area per unit of time. In contrast, the biomass measurement is in units of mass per unit area or volume. The P/B ratio utilizes inverse time units (example: 1/month). This ratio allows for an estimate of the amount of energy flow compared to the amount of biomass at a given trophic level, allowing for demarcations to be made between trophic levels. The P/B ratio most commonly decreases as trophic level and organismal size increases, with small, ephemeral organisms containing a higher P/B ratio than large, long-lasting ones.
Examples: The bristlecone pine can live for thousands of years, and has a very low production/biomass ratio. The cyanobacterium Prochlorococcus lives for about 24 hours, and has a very high production/biomass ratio.
In oceans, most primary production is performed by algae. This is a contrast to on land, where most primary production is performed by vascular plants.
| Ecosystem | Net primary productivity (Gt/y) | Total plant biomass (Gt) | Turnover time (y) |
|---|---|---|---|
| Marine | 45–55 | 1–2 | 0.02–0.06 |
| Terrestrial | 55–70 | 600–1000 | 9–20 |

Aquatic producers, such as planktonic algae or aquatic plants, lack the large accumulation of secondary growth that exists in the woody trees of terrestrial ecosystems. However, they are able to reproduce quickly enough to support a larger biomass of grazers. This inverts the pyramid. Primary consumers have longer lifespans and slower growth rates that accumulates more biomass than the producers they consume. Phytoplankton live just a few days, whereas the zooplankton eating the phytoplankton live for several weeks and the fish eating the zooplankton live for several consecutive years. Aquatic predators also tend to have a lower death rate than the smaller consumers, which contributes to the inverted pyramidal pattern. Population structure, migration rates, and environmental refuge for prey are other possible causes for pyramids with biomass inverted. Energy pyramids, however, will always have an upright pyramid shape if all sources of food energy are included, since this is dictated by the second law of thermodynamics."
Most organic matter produced is eventually consumed and respired to inorganic carbon. The rate at which organic matter is preserved via burial by accumulating sediments is only between 0.2 and 0.4 billion tonnes per year, representing a very small fraction of the total production. Global phytoplankton production is about 50 billion tonnes per year and phytoplankton biomass is about one billion tonnes, implying a turnover time of one week. Marine macrophytes have a similar global biomass but a production of only one billion tonnes per year, implying a turnover time of one year. These high turnover rates (compared with global terrestrial vegetation turnover of one to two decades) imply not only steady production, but also efficient consumption of organic matter. There are multiple organic matter loss pathways (respiration by autotrophs and heterotrophs, grazing, viral lysis, detrital route), but all eventually result in respiration and release of inorganic carbon.
Anthropogenic effects

- Overfishing
- Acidification
Pteropods and brittle stars together form the base of the Arctic food webs and both are seriously damaged by acidification. Pteropods shells dissolve with increasing acidification and brittle stars lose muscle mass when re-growing appendages. Additionally the brittle star's eggs die within a few days when exposed to expected conditions resulting from Arctic acidification. Acidification threatens to destroy Arctic food webs from the base up. Arctic waters are changing rapidly and are advanced in the process of becoming undersaturated with aragonite. Arctic food webs are considered simple, meaning there are few steps in the food chain from small organisms to larger predators. For example, pteropods are "a key prey item of a number of higher predators – larger plankton, fish, seabirds, whales".
Effects of ocean acidification Unhealthy pteropod showing effects of ocean acidification
 Ocean acidification causes brittle stars to lose muscle massPteropods and brittle stars form the base of Arctic food webs
- Climate change
Ecosystems in the ocean are more sensitive to climate change than anywhere else on Earth. This is due to warmer temperatures and ocean acidification. With the ocean temperatures increasing, it is predicted that fish species will move from their known ranges and locate new areas. During this change, the numbers within each species will drop significantly. Currently there are many relationships between predators and prey, where they rely on one another to survive. With a shift in where species will be located, the predator-prey relationships/interactions will be greatly impacted. Studies are still being done to understand how these changes will affect the food-web dynamics.
Using modeling, scientists are able to analyze the trophic interactions that certain species thrive in and due to other species also found in these areas. Through recent models, it is seen that many of the larger marine species will end up shifting their ranges at a slower pace than climate change suggests. This would impact the predator-prey relationship even more. As the smaller species and organisms are more likely to be influenced from the oceans warming and moving sooner than the larger mammals. These predators are seen to stay longer in their historical ranges before moving because of the movement of the smaller species moving. With "new" species entering the space of the larger mammals, the ecology changes and more prey for them to feed upon. The smaller species would end up having a smaller range, whereas the larger mammals would have extended their range. The shifting dynamics will have great effects on all species within the ocean and will result in many more changes impacting our entire ecosystem. With the movement in where predators can find prey within the ocean, will also impact the fisheries industry. Where fishermen currently know where certain fish species occupy, as the shift occurs it will be more difficult to figure out where they are spending their time, costing them more money as they may have to travel further. As a result, this could impact the current fishing regulations set up for certain areas with the movement of these fish populations.
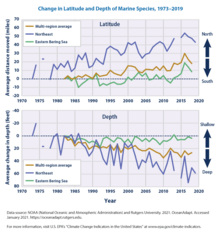
Through a survey conducted at Princeton University, researchers found that the marine species are consistently keeping pace with "climate velocity" or speed and direction in which it is moving. Looking at data from 1968 to 2011, it was found that 70 per cent of the shifts in animals' depths and 74 per cent of changes in latitude correlated with regional-scale fluctuations in ocean temperature. These movements are causing species to move between 4.5 and 40 miles per decade further away from the equator. With the help of models, regions can predict where the species may end up. Models will have to adapt to the changes as more is learned about how climate is affecting species.
"Our results show how future climate change can potentially weaken marine food webs through reduced energy flow to higher trophic levels and a shift towards a more detritus-based system, leading to food web simplification and altered producer–consumer dynamics, both of which have important implications for the structuring of benthic communities."
"...increased temperatures reduce the vital flow of energy from the primary food producers at the bottom (e.g. algae), to intermediate consumers (herbivores), to predators at the top of marine food webs. Such disturbances in energy transfer can potentially lead to a decrease in food availability for top predators, which in turn, can lead to negative impacts for many marine species within these food webs... "Whilst climate change increased the productivity of plants, this was mainly due to an expansion of cyanobacteria (small blue-green algae)," said Mr Ullah. "This increased primary productivity does not support food webs, however, because these cyanobacteria are largely unpalatable and they are not consumed by herbivores. Understanding how ecosystems function under the effects of global warming is a challenge in ecological research. Most research on ocean warming involves simplified, short-term experiments based on only one or a few species."

See also
References
- Dunne, Jennifer A.; Williams, Richard J.; Martinez, Neo D. (October 2002). "Food-web structure and network theory: The role of connectance and size". Proceedings of the National Academy of Sciences. 99 (20): 12917–12922. Bibcode:2002PNAS...9912917D. doi:10.1073/pnas.192407699. ISSN 0027-8424. PMC 130560. PMID 12235364.
- Dunne, Jennifer A (22 December 2005). "The Network Structure of Food Webs". In Pascual, Mercedes; Dunne, Jennifer A (eds.). Ecological Networks. Oxford University PressNew York, NY. pp. 27–92. doi:10.1093/oso/9780195188165.003.0002. ISBN 978-0-19-518816-5.
- Karlson, Agnes M. L.; Gorokhova, Elena; Gårdmark, Anna; Pekcan-Hekim, Zeynep; Casini, Michele; Albertsson, Jan; Sundelin, Brita; Karlsson, Olle; Bergström, Lena (February 2020). "Linking consumer physiological status to food-web structure and prey food value in the Baltic Sea". Ambio. 49 (2): 391–406. Bibcode:2020Ambio..49..391K. doi:10.1007/s13280-019-01201-1. ISSN 0044-7447. PMC 6965491. PMID 31168701.
- Odum, W. E.; Heald, E. J. (1975) "The detritus-based food web of an estuarine mangrove community". Pages 265–286 in L. E. Cronin, ed. Estuarine research. Vol. 1. Academic Press, New York.
- Pimm, S. L.; Lawton, J. H. (1978). "On feeding on more than one trophic level". Nature. 275 (5680): 542–544. Bibcode:1978Natur.275..542P. doi:10.1038/275542a0. S2CID 4161183.
- Pauly, D.; Palomares, M. L. (2005). "Fishing down marine food webs: it is far more pervasive than we thought" (PDF). Bulletin of Marine Science. 76 (2): 197–211. Archived from the original (PDF) on 14 May 2013. Retrieved 20 March 2020.
- Cortés, E. (1999). "Standardized diet compositions and trophic levels of sharks". ICES J. Mar. Sci. 56 (5): 707–717. Bibcode:1999ICJMS..56..707C. doi:10.1006/jmsc.1999.0489.
- Pauly, D.; Trites, A.; Capuli, E.; Christensen, V. (1998). "Diet composition and trophic levels of marine mammals". ICES J. Mar. Sci. 55 (3): 467–481. Bibcode:1998ICJMS..55..467P. doi:10.1006/jmsc.1997.0280.
- Researchers calculate human trophic level for first time Phys.org . 3 December 2013.
- Bonhommeau, Sylvain; Dubroca, Laurent; Le Pape, Olivier; Barde, Julien; Kaplan, David M.; Chassot, Emmanuel; Nieblas, Anne-Elise (17 December 2013). "Eating up the world's food web and the human trophic level". Proceedings of the National Academy of Sciences. 110 (51): 20617–20620. Bibcode:2013PNAS..11020617B. doi:10.1073/pnas.1305827110. ISSN 0027-8424. PMC 3870703. PMID 24297882.
- ^ Chlorophyll NASA Earth Observatory. Accessed 30 November 2019.
- Guo, Ruoyu; Liang, Yantao; Xin, Yu; Wang, Long; Mou, Shanli; Cao, Chunjie; Xie, Ruize; Zhang, Chuanlun; Tian, Jiwei; Zhang, Yongyu (26 September 2018). "Insight Into the Pico- and Nano-Phytoplankton Communities in the Deepest Biosphere, the Mariana Trench". Frontiers in Microbiology. 9. Frontiers Media SA: 2289. doi:10.3389/fmicb.2018.02289. ISSN 1664-302X. PMC 6168665. PMID 30319587.
- Heinrichs, Mara E.; Mori, Corinna; Dlugosch, Leon (2020). Jungblut, Simon; Liebich, Viola; Bode-Dalby, Maya (eds.). Complex Interactions Between Aquatic Organisms and Their Chemical Environment Elucidated from Different Perspectives. Cham: Springer International Publishing. pp. 279–297. doi:10.1007/978-3-030-20389-4_15. ISBN 978-3-030-20388-7.
- Field, C. B. (10 July 1998). "Primary Production of the Biosphere: Integrating Terrestrial and Oceanic Components". Science. 281 (5374): 237–240. Bibcode:1998Sci...281..237F. doi:10.1126/science.281.5374.237. PMID 9657713.
- Mouw, Colleen B.; Barnett, Audrey; McKinley, Galen A.; Gloege, Lucas; Pilcher, Darren (20 October 2016). "Global ocean particulate organic carbon flux merged with satellite parameters". Earth System Science Data. 8 (2): 531–541. Bibcode:2016ESSD....8..531M. doi:10.5194/essd-8-531-2016. ISSN 1866-3508. S2CID 54551421.
- Campbell, Mike (22 June 2011). "The role of marine plankton in sequestration of carbon". EarthTimes. Retrieved 22 August 2014.
- Why should we care about the ocean? NOAA: National Ocean Service. Updated: 7 January 2020. Retrieved 1 March 2020.
- Kettler GC, Martiny AC, Huang K, Zucker J, Coleman ML, Rodrigue S, Chen F, Lapidus A, Ferriera S, Johnson J, Steglich C, Church GM, Richardson P, Chisholm SW (December 2007). "Patterns and implications of gene gain and loss in the evolution of Prochlorococcus". PLOS Genetics. 3 (12): e231. doi:10.1371/journal.pgen.0030231. PMC 2151091. PMID 18159947.
- Nemiroff, R.; Bonnell, J., eds. (27 September 2006). "Earth from Saturn". Astronomy Picture of the Day. NASA.
- Partensky F, Hess WR, Vaulot D (March 1999). "Prochlorococcus, a marine photosynthetic prokaryote of global significance". Microbiology and Molecular Biology Reviews. 63 (1): 106–27. doi:10.1128/MMBR.63.1.106-127.1999. PMC 98958. PMID 10066832.
- "The Most Important Microbe You've Never Heard Of". npr.org.
- Mann, D. G. (1999). "The species concept in diatoms". Phycologia. 38 (6): 437–495. Bibcode:1999Phyco..38..437M. doi:10.2216/i0031-8884-38-6-437.1.
- Lynn DH (24 June 2008). The Ciliated Protozoa: Characterization, Classification, and Guide to the Literature (3 ed.). Springer. p. 122. ISBN 978-1-4020-8239-9.
- Biology of Copepods Archived 2009-01-01 at the Wayback Machine at Carl von Ossietzky University of Oldenburg
- ^ Hays, Graeme C.; Doyle, Thomas K.; Houghton, Jonathan D.R. (November 2018). "A Paradigm Shift in the Trophic Importance of Jellyfish?". Trends in Ecology & Evolution. 33 (11): 874–884. Bibcode:2018TEcoE..33..874H. doi:10.1016/j.tree.2018.09.001. PMID 30245075.
- ^ Hamilton, Garry (24 March 2016). "The secret lives of jellyfish". Nature. 531 (7595): 432–434. Bibcode:2016Natur.531..432H. doi:10.1038/531432a. ISSN 0028-0836.
- Cardona, Luis; Álvarez de Quevedo, Irene; Borrell, Assumpció; Aguilar, Alex (21 March 2012). Ropert-Coudert, Yan (ed.). "Massive Consumption of Gelatinous Plankton by Mediterranean Apex Predators". PLOS ONE. 7 (3): e31329. Bibcode:2012PLoSO...731329C. doi:10.1371/journal.pone.0031329. ISSN 1932-6203. PMC 3310041. PMID 22470416.
- Tiny Forage Fish At Bottom Of Marine Food Web Get New Protections National Public Radio, 7 April 2016.
- Roman, J.; McCarthy, J.J. (2010). "The Whale Pump: Marine Mammals Enhance Primary Productivity in a Coastal Basin". PLOS ONE. 5 (10): e13255. Bibcode:2010PLoSO...513255R. doi:10.1371/journal.pone.0013255. PMC 2952594. PMID 20949007. e13255.
- Brown, Joshua E. (12 October 2010). "Whale poop pumps up ocean health". Science Daily. Retrieved 18 August 2014.
- Raina, Jean-Baptiste (24 April 2018). "The Life Aquatic at the Microscale". mSystems. 3 (2). doi:10.1128/mSystems.00150-17. ISSN 2379-5077. PMC 5881019. PMID 29629412.
 Modified text was copied from this source, which is available under a Creative Commons Attribution 4.0 International License.
- Marco, D, ed. (2011). Metagenomics: Current Innovations and Future Trends. Caister Academic Press. ISBN 978-1-904455-87-5.
- ^ Roslin, T. and Majaneva, S. (2016) "The use of DNA barcodes in food web construction—terrestrial and aquatic ecologists unite!". Genome, 59(9): 603–628. doi:10.1139/gen-2015-0229.
- Wilhelm, Steven W.; Suttle, Curtis A. (1999). "Viruses and Nutrient Cycles in the Sea". BioScience. 49 (10): 781–788. doi:10.2307/1313569. ISSN 1525-3244. JSTOR 1313569.
- Weinbauer, Markus G.; Hornák, Karel; Jezbera, Jan; Nedoma, Jiri; Dolan, John R.; Simek, Karel (March 2007). "Synergistic and antagonistic effects of viral lysis and protistan grazing on bacterial biomass, production and diversity". Environmental Microbiology. 9 (3): 777–788. Bibcode:2007EnvMi...9..777W. doi:10.1111/j.1462-2920.2006.01200.x. ISSN 1462-2912. PMID 17298376.
- Robinson, Carol, and Nagappa Ramaiah. "Microbial heterotrophic metabolic rates constrain the microbial carbon pump." The American Association for the Advancement of Science, 2011.
- Van den Meersche, Karel; Middelburg, Jack J.; Soetaert, Karline; van Rijswijk, Pieter; Boschker, Henricus T. S.; Heip, Carlo H. R. (May 2004). "Carbon-nitrogen coupling and algal-bacterial interactions during an experimental bloom: Modeling a 13 C tracer experiment". Limnology and Oceanography. 49 (3): 862–878. Bibcode:2004LimOc..49..862V. doi:10.4319/lo.2004.49.3.0862. ISSN 0024-3590.
- Käse L, Geuer JK. (2018) "Phytoplankton Responses to Marine Climate Change – An Introduction". In Jungblut S., Liebich V., Bode M. (Eds) YOUMARES 8–Oceans Across Boundaries: Learning from each other, pages 55–72, Springer. doi:10.1007/978-3-319-93284-2_5.
 Modified text was copied from this source, which is available under a Creative Commons Attribution 4.0 International License.
- Heinrichs, M.E., Mori, C. and Dlugosch, L. (2020) "Complex Interactions Between Aquatic Organisms and Their Chemical Environment Elucidated from Different Perspectives". In: YOUMARES 9-The Oceans: Our Research, Our Future , pages 279–297. Springer. doi:10.1007/978-3-030-20389-4_15.
- Duponchel, S. and Fischer, M.G. (2019) "Viva lavidaviruses! Five features of virophages that parasitize giant DNA viruses". PLoS pathogens, 15(3). doi:10.1371/journal.ppat.1007592.
 Modified text was copied from this source, which is available under a Creative Commons Attribution 4.0 International License.
- ^ Suttle, Curtis A. (2007). "Marine viruses — major players in the global ecosystem". Nature Reviews Microbiology. 5 (10): 801–812. doi:10.1038/nrmicro1750. PMID 17853907. S2CID 4658457.
- ^ Middelboe, Mathias; Brussaard, Corina (2017). "Marine Viruses: Key Players in Marine Ecosystems". Viruses. 9 (10): 302. doi:10.3390/v9100302. PMC 5691653. PMID 29057790.
- Bergh, Øivind; Børsheim, Knut Yngve; Bratbak, Gunnar; Heldal, Mikal (1989). "High abundance of viruses found in aquatic environments". Nature. 340 (6233): 467–468. Bibcode:1989Natur.340..467B. doi:10.1038/340467a0. PMID 2755508. S2CID 4271861.
- Roux, Simon; Hallam, Steven J.; Woyke, Tanja; Sullivan, Matthew B. (2015). "Viral dark matter and virus–host interactions resolved from publicly available microbial genomes". eLife. 4. doi:10.7554/eLife.08490. PMC 4533152. PMID 26200428.
- ^ Yau, Sheree; Seth-Pasricha, Mansha (2019). "Viruses of Polar Aquatic Environments". Viruses. 11 (2): 189. doi:10.3390/v11020189. PMC 6410135. PMID 30813316.
 Modified text was copied from this source, which is available under a Creative Commons Attribution 4.0 International License.
- Fischer, M. G.; Allen, M. J.; Wilson, W. H.; Suttle, C. A. (2010). "Giant virus with a remarkable complement of genes infects marine zooplankton" (PDF). Proceedings of the National Academy of Sciences. 107 (45): 19508–19513. Bibcode:2010PNAS..10719508F. doi:10.1073/pnas.1007615107. PMC 2984142. PMID 20974979.
- Matthias G. Fischer; Michael J. Allen; William H. Wilson; Curtis A. Suttle (2010). "Giant virus with a remarkable complement of genes infects marine zooplankton" (PDF). Proceedings of the National Academy of Sciences. 107 (45): 19508–19513. Bibcode:2010PNAS..10719508F. doi:10.1073/pnas.1007615107. PMC 2984142. PMID 20974979.
- Massana, Ramon; Javier Del Campo; Christian Dinter; Ruben Sommaruga (2007). "Crash of a population of the marine heterotrophic flagellate Cafeteria roenbergensis by viral infection". Environmental Microbiology. 9 (11): 2660–2669. Bibcode:2007EnvMi...9.2660M. doi:10.1111/j.1462-2920.2007.01378.x. PMID 17922751. S2CID 30191542.
- Fischer MG, Suttle CA (April 2011). "A virophage at the origin of large DNA transposons". Science. 332 (6026): 231–4. Bibcode:2011Sci...332..231F. doi:10.1126/science.1199412. PMID 21385722. S2CID 206530677.
- Fischer MG, Hackl (December 2016). "Host genome integration and giant virus-induced reactivation of the virophage mavirus". Nature. 540 (7632): 288–91. Bibcode:2016Natur.540..288F. doi:10.1038/nature20593. PMID 27929021. S2CID 4458402.
- Kagami, M., Miki, T. and Takimoto, G. (2014) "Mycoloop: chytrids in aquatic food webs". Frontiers in microbiology, 5: 166. doi:10.3389/fmicb.2014.00166.
 Modified text was copied from this source, which is available under a Creative Commons Attribution 3.0 International License.
- Amend, A., Burgaud, G., Cunliffe, M., Edgcomb, V.P., Ettinger, C.L., Gutiérrez, M.H., Heitman, J., Hom, E.F., Ianiri, G., Jones, A.C. and Kagami, M. (2019) "Fungi in the marine environment: Open questions and unsolved problems". MBio, 10(2): e01189-18. doi:10.1128/mBio.01189-18.
 Modified text was copied from this source, which is available under a Creative Commons Attribution 4.0 International License.
- Gutiérrez, Marcelo H.; Jara, Ana M.; Pantoja, Silvio (May 2016). "Fungal parasites infect marine diatoms in the upwelling ecosystem of the Humboldt current system off central Chile". Environmental Microbiology. 18 (5): 1646–1653. Bibcode:2016EnvMi..18.1646G. doi:10.1111/1462-2920.13257. ISSN 1462-2912. PMID 26914416.
- ^ Middelburg, Jack J. (2019). "The Return from Organic to Inorganic Carbon". Marine Carbon Biogeochemistry. SpringerBriefs in Earth System Sciences. pp. 37–56. doi:10.1007/978-3-030-10822-9_3. ISBN 978-3-030-10821-2. S2CID 104330175.
 Modified text was copied from this source, which is available under a Creative Commons Attribution 4.0 International License.
- Legendre L, Rassoulzadegan F (1995) "Plankton and nutrient dynamics in marine waters". Ophelia, 41:153–172.
- Pace ML, Cole JJ, Carpenter SR, Kitchell JF (1999) "Trophic cascades revealed in diverse ecosystems". Trends Ecol Evol, 14: 483–488.
- Azam F, Fenchel T, Field JG, Gray JS, Meyer-Reil LA, Thingstad F (1983) "The ecological role of water-column microbes in the sea". Mar Ecol-Prog Ser, 10: 257–263.
- Anderson TR and LeB Williams PJ (1998) "Modelling the seasonal cycle of dissolved organic carbon at station E1 in the English channel". Estuar Coast Shelf Sci, 46: 93–109.
- Van den Meersche K, Middelburg JJ, Soetaert K, van Rijswijk P, Boschker HTS, Heip CHR (2004) "Carbon–nitrogen coupling and algal–bacterial interactions during an experimental bloom: modeling a 13C tracer experiment". Limnol Oceanogr, 49: 862–878.
- Suttle CA (2005) "Viruses in the sea". Nature, 437: 356–361.
- Siegel, David A.; Buesseler, Ken O.; Behrenfeld, Michael J.; Benitez-Nelson, Claudia R.; Boss, Emmanuel; Brzezinski, Mark A.; Burd, Adrian; Carlson, Craig A.; d'Asaro, Eric A.; Doney, Scott C.; Perry, Mary J.; Stanley, Rachel H. R.; Steinberg, Deborah K. (2016). "Prediction of the Export and Fate of Global Ocean Net Primary Production: The EXPORTS Science Plan". Frontiers in Marine Science. 3. doi:10.3389/fmars.2016.00022.
 Modified text was copied from this source, which is available under a Creative Commons Attribution 4.0 International License.
- Wang, F., Wu, Y., Chen, Z., Zhang, G., Zhang, J., Zheng, S. and Kattner, G. (2019) "Trophic interactions of mesopelagic fishes in the South China Sea illustrated by stable isotopes and fatty acids". Frontiers in Marine Science, 5: 522. doi:10.3389/fmars.2018.00522.
- ^ Tollefson, Jeff (27 February 2020) Enter the twilight zone: scientists dive into the oceans' mysterious middle Nature News. doi:10.1038/d41586-020-00520-8.
- ^ Choy, C.A., Haddock, S.H. and Robison, B.H. (2017) "Deep pelagic food web structure as revealed by in situ feeding observations". Proceedings of the Royal Society B: Biological Sciences, 284(1868): 20172116. doi:10.1098/rspb.2017.2116.
 Modified text was copied from this source, which is available under a Creative Commons Attribution 4.0 International License.
- Kelly, T.B., Davison, P.C., Goericke, R., Landry, M.R., Ohman, M. and Stukel, M.R. (2019) "The importance of mesozooplankton diel vertical migration for sustaining a mesopelagic food web". Frontiers in Marine Science, 6: 508. doi:10.3389/fmars.2019.00508.
- Climate change in deep oceans could be seven times faster by middle of century, report says The Guardian, 25 May 2020.
- Brito-Morales, I., Schoeman, D.S., Molinos, J.G., Burrows, M.T., Klein, C.J., Arafeh-Dalmau, N., Kaschner, K., Garilao, C., Kesner-Reyes, K. and Richardson, A.J. (2020) "Climate velocity reveals increasing exposure of deep-ocean biodiversity to future warming". Nature Climate Change, pp.1-6. doi:10.5281/zenodo.3596584.
- Irigoien, X., Klevjer, T.A., Røstad, A., Martinez, U., Boyra, G., Acuña, J.L., Bode, A., Echevarria, F., Gonzalez-Gordillo, J.I., Hernandez-Leon, S. and Agusti, S. (2014) "Large mesopelagic fishes biomass and trophic efficiency in the open ocean". Nature communications, 5: 3271. doi:10.1038/ncomms4271
- Fish biomass in the ocean is 10 times higher than estimated EurekAlert, 7 February 2014.
- Choy, C.A., Wabnitz, C.C., Weijerman, M., Woodworth-Jefcoats, P.A. and Polovina, J.J. (2016) "Finding the way to the top: how the composition of oceanic mid-trophic micronekton groups determines apex predator biomass in the central North Pacific". Marine Ecology Progress Series, 549: 9–25. doi:10.3354/meps11680.
- ^ Kurata, N., Vella, K., Hamilton, B., Shivji, M., Soloviev, A., Matt, S., Tartar, A. and Perrie, W. (2016) "Surfactant-associated bacteria in the near-surface layer of the ocean". Scientific Reports, 6(1): 1–8. doi:10.1038/srep19123.
 Modified text was copied from this source, which is available under a Creative Commons Attribution 4.0 International License.
- Ẑutić, V., Ćosović, B., Marčenko, E., Bihari, N. and Kršinić, F. (1981) "Surfactant production by marine phytoplankton". Marine Chemistry, 10(6): 505–520. doi:10.1016/0304-4203(81)90004-9.
- Levin LA, Baco AR, Bowden DA, Colaco A, Cordes EE, Cunha MR, Demopoulos AWJ, Gobin J, Grupe BM, Le J, Metaxas A, Netburn AN, Rouse GW, Thurber AR, Tunnicliffe V, Van Dover CL, Vanreusel A and Watling L (2016). "Hydrothermal Vents and Methane Seeps: Rethinking the Sphere of Influence". Front. Mar. Sci. 3:72. doi:10.3389/fmars.2016.00072
- Portail, M., Olu, K., Dubois, S.F., Escobar-Briones, E., Gelinas, Y., Menot, L. and Sarrazin, J. (2016). "Food-web complexity in Guaymas Basin hydrothermal vents and cold seeps". PLOS ONE, 11(9): p.e0162263. doi:10.1371/journal.pone.0162263.
- Bernardino AF, Levin LA, Thurber AR and Smith CR (2012). "Comparative Composition, Diversity and Trophic Ecology of Sediment Macrofauna at Vents, Seeps and Organic Falls". PLOS ONE, 7(4): e33515. PMID 22496753. doi:10.1371/journal.pone.0033515.
- Portail M, Olu K, Escobar-Briones E, Caprais JC, Menot L, Waeles M, et al. (2015). "Comparative study of vent and seep macrofaunal communities in the Guaymas Basin". Biogeosciences. 12(18): 5455–79. doi:10.5194/bg-12-5455-2015.
- Harris, P.T.; Macmillan-Lawler, M.; Rupp, J.; Baker, E.K. (2014). "Geomorphology of the oceans". Marine Geology. 352: 4–24. Bibcode:2014MGeol.352....4H. doi:10.1016/j.margeo.2014.01.011.
- ^ Otero, X.L., De La Peña-Lastra, S., Pérez-Alberti, A., Ferreira, T.O. and Huerta-Diaz, M.A. (2018) "Seabird colonies as important global drivers in the nitrogen and phosphorus cycles". Nature communications, 9(1): 1–8. doi:10.1038/s41467-017-02446-8. Modified text was copied from this source, which is available under a Creative Commons Attribution 4.0 International License.
- Barrett, Kyle; Anderson, Wendy B.; Wait, D. Alexander; Grismer, L. Lee; Polis†, Gary A.; Rose†, Michael D. (2005). "Marine subsidies alter the diet and abundance of insular and coastal lizard populations". Oikos. 109 (1): 145–153. Bibcode:2005Oikos.109..145B. doi:10.1111/j.0030-1299.2005.13728.x.
- Polis, Gary A.; Hurd, Stephen D. (1996). "Linking Marine and Terrestrial Food Webs: Allochthonous Input from the Ocean Supports High Secondary Productivity on Small Islands and Coastal Land Communities". The American Naturalist. 147 (3): 396–423. doi:10.1086/285858. S2CID 84701185.
- Gende, Scott M.; Edwards, Richard T.; Willson, Mary F.; Wipfli, Mark S. (2002). "Pacific Salmon in Aquatic and Terrestrial Ecosystems". BioScience. 52 (10): 917. doi:10.1641/0006-3568(2002)052[0917:PSIAAT]2.0.CO;2. ISSN 0006-3568. JSTOR 10.1641/0006-3568(2002)052[0917:PSIAAT]2.0.CO;2.
- ^ Gagnon, Karine; Rothäusler, Eva; Syrjänen, Anneli; Yli-Renko, Maria; Jormalainen, Veijo (2013). "Seabird Guano Fertilizes Baltic Sea Littoral Food Webs". PLOS ONE. 8 (4): e61284. Bibcode:2013PLoSO...861284G. doi:10.1371/journal.pone.0061284. PMC 3623859. PMID 23593452.
- Mizota, Chitoshi; Noborio, Kosuke; Mori, Yoshiaki (2012). "The Great Cormorant (Phalacrocorax carbo) colony as a "hot spot" of nitrous oxide (N2O) emission in central Japan". Atmospheric Environment. 57: 29–34. Bibcode:2012AtmEn..57...29M. doi:10.1016/j.atmosenv.2012.02.007.
- Bird, Michael I.; Tait, Elaine; Wurster, Christopher M.; Furness, Robert W. (2008). "Stable carbon and nitrogen isotope analysis of avian uric acid". Rapid Communications in Mass Spectrometry. 22 (21): 3393–3400. Bibcode:2008RCMS...22.3393B. doi:10.1002/rcm.3739. PMID 18837063.
- ^ Caut, Stéphane; Angulo, Elena; Pisanu, Benoit; Ruffino, Lise; Faulquier, Lucie; Lorvelec, Olivier; Chapuis, Jean-Louis; Pascal, Michel; Vidal, Eric; Courchamp, Franck (2012). "Seabird Modulations of Isotopic Nitrogen on Islands". PLOS ONE. 7 (6): e39125. Bibcode:2012PLoSO...739125C. doi:10.1371/journal.pone.0039125. PMC 3377609. PMID 22723945.
- Mulder, Christa P. H.; Anderson, Wendy B.; Towns, David R.; Bellingham, Peter J. (8 September 2011). Seabird Islands: Ecology, Invasion, and Restoration. Oup USA. ISBN 9780199735693.
- McFadden, Tyler Neal; Kauffman, J. Boone; Bhomia, Rupesh K. (2016). "Effects of nesting waterbirds on nutrient levels in mangroves, Gulf of Fonseca, Honduras". Wetlands Ecology and Management. 24 (2): 217–229. Bibcode:2016WetEM..24..217M. doi:10.1007/s11273-016-9480-4. S2CID 6021420.
- Zwolicki, Adrian; Zmudczyńska-Skarbek, Katarzyna Małgorzata; Iliszko, Lech; Stempniewicz, Lech (2013). "Guano deposition and nutrient enrichment in the vicinity of planktivorous and piscivorous seabird colonies in Spitsbergen". Polar Biology. 36 (3): 363–372. Bibcode:2013PoBio..36..363Z. doi:10.1007/s00300-012-1265-5. S2CID 12110520.
- Doughty, Christopher E.; Roman, Joe; Faurby, Søren; Wolf, Adam; Haque, Alifa; Bakker, Elisabeth S.; Malhi, Yadvinder; Dunning, John B.; Svenning, Jens-Christian (2016). "Global nutrient transport in a world of giants". Proceedings of the National Academy of Sciences. 113 (4): 868–873. Bibcode:2016PNAS..113..868D. doi:10.1073/pnas.1502549112. PMC 4743783. PMID 26504209.
- ^ Honig, Susanna E.; Mahoney, Brenna (2016). "Evidence of seabird guano enrichment on a coral reef in Oahu, Hawaii". Marine Biology. 163 (2): 22. Bibcode:2016MarBi.163...22H. doi:10.1007/s00227-015-2808-4. S2CID 87850538.
- Kolb, GS; Ekholm, J.; Hambäck, PA (2010). "Effects of seabird nesting colonies on algae and aquatic invertebrates in coastal waters". Marine Ecology Progress Series. 417: 287–300. Bibcode:2010MEPS..417..287K. doi:10.3354/meps08791.
- Wainright, S. C.; Haney, J. C.; Kerr, C.; Golovkin, A. N.; Flint, M. V. (1998). "Utilization of nitrogen derived from seabird guano by terrestrial and marine plants at St. Paul, Pribilof Islands, Bering Sea, Alaska". Marine Biology. 131 (1): 63–71. Bibcode:1998MarBi.131...63W. doi:10.1007/s002270050297. S2CID 83734364.
- Staunton Smith, J.; Johnson, CR (1995). "Nutrient inputs from seabirds and humans on a populated coral cay". Marine Ecology Progress Series. 124: 189–200. Bibcode:1995MEPS..124..189S. doi:10.3354/meps124189.
- ^ Lorrain, Anne; Houlbrèque, Fanny; Benzoni, Francesca; Barjon, Lucie; Tremblay-Boyer, Laura; Menkes, Christophe; Gillikin, David P.; Payri, Claude; Jourdan, Hervé; Boussarie, Germain; Verheyden, Anouk; Vidal, Eric (2017). "Seabirds supply nitrogen to reef-building corals on remote Pacific islets". Scientific Reports. 7 (1): 3721. Bibcode:2017NatSR...7.3721L. doi:10.1038/s41598-017-03781-y. PMC 5473863. PMID 28623288. S2CID 6539261.
 Modified text was copied from this source, which is available under a Creative Commons Attribution 4.0 International License.
- Connell, Des W. (4 May 2018). Pollution in Tropical Aquatic Systems. CRC Press. ISBN 9781351092777.
- Hatcher, Bruce Gordon (1990). "Coral reef primary productivity. A hierarchy of pattern and process". Trends in Ecology & Evolution. 5 (5): 149–155. Bibcode:1990TEcoE...5..149H. doi:10.1016/0169-5347(90)90221-X. PMID 21232343.
- Falkowski, Paul G.; Dubinsky, Zvy; Muscatine, Leonard; McCloskey, Lawrence (1993). "Population Control in Symbiotic Corals". BioScience. 43 (9): 606–611. doi:10.2307/1312147. JSTOR 1312147.
- ^ Marubini, F.; Davies, P. S. (1996). "Nitrate increases zooxanthellae population density and reduces skeletogenesis in corals". Marine Biology. 127 (2): 319–328. Bibcode:1996MarBi.127..319M. doi:10.1007/BF00942117. S2CID 85085823.
- Muscatine, L. (1990) "The role of symbiotic algae in carbon and energy flux in reef corals", Ecosystem World, 25: 75–87.
- Ferrier, M. Drew (1991). "Net uptake of dissolved free amino acids by four scleractinian corals". Coral Reefs. 10 (4): 183–187. Bibcode:1991CorRe..10..183F. doi:10.1007/BF00336772. S2CID 25973061.
- Furla, P.; Allemand, D.; Shick, J. M.; Ferrier-Pagès, C.; Richier, S.; Plantivaux, A.; Merle, P. L.; Tambutté, S. (2005). "The Symbiotic Anthozoan: A Physiological Chimera between Alga and Animal". Integrative and Comparative Biology. 45 (4): 595–604. doi:10.1093/icb/45.4.595. PMID 21676806.
- Mills, Matthew M.; Lipschultz, Fredric; Sebens, Kenneth P. (2004). "Particulate matter ingestion and associated nitrogen uptake by four species of scleractinian corals". Coral Reefs. 23 (3): 311–323. doi:10.1007/s00338-004-0380-3. S2CID 13212636.
- Mills, M. M.; Sebens, K. P. (2004). "Ingestion and assimilation of nitrogen from benthic sediments by three species of coral". Marine Biology. 145 (6): 1097–1106. Bibcode:2004MarBi.145.1097M. doi:10.1007/s00227-004-1398-3. S2CID 84698653.
- Houlbrèque, F.; Tambutté, E.; Richard, C.; Ferrier-Pagès, C. (2004). "Importance of a micro-diet for scleractinian corals". Marine Ecology Progress Series. 282: 151–160. Bibcode:2004MEPS..282..151H. doi:10.3354/meps282151.
- Ferrier-Pagès, C.; Witting, J.; Tambutté, E.; Sebens, K. P. (2003). "Effect of natural zooplankton feeding on the tissue and skeletal growth of the scleractinian coral Stylophora pistillata". Coral Reefs. 22 (3): 229–240. doi:10.1007/s00338-003-0312-7. S2CID 44869188.
- Marubini, Francesca; Thake, Brenda (1999). "Bicarbonate addition promotes coral growth". Limnology and Oceanography. 44 (3): 716–720. Bibcode:1999LimOc..44..716M. doi:10.4319/lo.1999.44.3.0716. S2CID 83654833.
- Ferrier-Pagès, C.; Leclercq, N.; Jaubert, J.; Pelegrí, SP (2000). "Enhancement of pico- and nanoplankton growth by coral exudates". Aquatic Microbial Ecology. 21: 203–209. doi:10.3354/ame021203.
- Renegar, DA; Riegl, BM (2005). "Effect of nutrient enrichment and elevated CO2 partial pressure on growth rate of Atlantic scleractinian coral Acropora cervicornis". Marine Ecology Progress Series. 293: 69–76. Bibcode:2005MEPS..293...69R. doi:10.3354/meps293069.
- Petersen, J.K., Holmer, M., Termansen, M. and Hasler, B. (2019) "Nutrient extraction through bivalves". In: Smaal A., Ferreira J., Grant J., Petersen J., Strand Ø. (eds) Goods and Services of Marine Bivalves, pages 179–208. Springer. doi:10.1007/978-3-319-96776-9_10. ISBN 9783319967769
- Heymans, J.J., Coll, M., Libralato, S., Morissette, L. and Christensen, V. (2014). "Global patterns in ecological indicators of marine food webs: a modelling approach". PLOS ONE, 9(4). doi:10.1371/journal.pone.0095845.
- Pranovi, F., Libralato, S., Raicevich, S., Granzotto, A., Pastres, R. and Giovanardi, O. (2003). "Mechanical clam dredging in Venice lagoon: ecosystem effects evaluated with a trophic mass-balance model". Marine Biology, 143(2): 393–403. doi:10.1007/s00227-003-1072-1.
- US Geological Survey (USGS). "Chapter 14: Changes in Food and Habitats of Waterbirds." Figure 14.1. Synthesis of U.S. Geological Survey Science for the Chesapeake Bay Ecosystem and Implications for Environmental Management. USGS Circular 1316.
 This article incorporates text from this source, which is in the public domain.
- Perry, M.C., Osenton, P.C., Wells-Berlin, A.M., and Kidwell, D.M., 2005, Food selection among Atlantic Coast sea ducks in relation to historic food habits, in Perry, M.C., Second North American Sea Duck Conference, November 7–11, 2005, Annapolis, Maryland, Program and Abstracts, USGS Patuxent Wildlife Research Center, Maryland, 123 p. (p. 105).
- Bowser, A.K., Diamond, A.W. and Addison, J.A. (2013) "From puffins to plankton: a DNA-based analysis of a seabird food chain in the northern Gulf of Maine". PLOS ONE, 8(12): e83152. doi:10.1371/journal.pone.0083152
- Leray M, Meyer CP, Mills SC. (2015) "Metabarcoding dietary analysis of coral dwelling predatory fish demonstrates the minor contribution of coral mutualists to their highly partitioned, generalist diet". PeerJ, 3: e1047. doi:10.7717/peerj.1047.
- Coll, M., Schmidt, A., Romanuk, T. and Lotze, H.K. (2011). "Food-web structure of seagrass communities across different spatial scales and human impacts". PLOS ONE, 6(7): e22591. doi:10.1371/journal.pone.0022591.
 Modified text was copied from this source, which is available under a Creative Commons Attribution 4.0 International License.
- Stat, M., Huggett, M.J., Bernasconi, R., DiBattista, J.D., Berry, T.E., Newman, S.J., Harvey, E.S. and Bunce, M. (2017) "Ecosystem biomonitoring with eDNA: metabarcoding across the tree of life in a tropical marine environment". Scientific Reports, 7(1): 1–11. doi:10.1038/s41598-017-12501-5.
- Archer, Stephanie K.; Kahn, Amanda S.; Thiess, Mary; Law, Lauren; Leys, Sally P.; Johannessen, Sophia C.; Layman, Craig A.; Burke, Lily; Dunham, Anya (24 September 2020). "Foundation Species Abundance Influences Food Web Topology on Glass Sponge Reefs". Frontiers in Marine Science. 7. Frontiers Media SA. doi:10.3389/fmars.2020.549478. ISSN 2296-7745.
 Modified text was copied from this source, which is available under a Creative Commons Attribution 4.0 International License.
- Lobo, Eduardo A.; Heinrich, Carla Giselda; Schuch, Marilia; Wetzel, Carlos Eduardo; Ector, Luc (2016), Necchi JR, Orlando (ed.), "Diatoms as Bioindicators in Rivers", River Algae, Springer International Publishing, pp. 245–271, doi:10.1007/978-3-319-31984-1_11, ISBN 9783319319834
- Stevenson, R. Jan; Pan, Yangdong; van Dam, Herman (2010), Smol, John P.; Stoermer, Eugene F. (eds.), "Assessing environmental conditions in rivers and streams with diatoms", The Diatoms (2 ed.), Cambridge University Press, pp. 57–85, doi:10.1017/cbo9780511763175.005, ISBN 9780511763175
- McCarthy, J.J., Canziani, O.F., Leary, N.A., Dokken, D.J. and White, K.S. (Eds.) (2001) Climate Change 2001: Impacts, Adaptation, and Vulnerability: Contribution of Working Group II to the Third Assessment Report of the Intergovernmental Panel on Climate Change Page 807, Cambridge University Press. ISBN 9780521015004
- Murphy, E. J.; Cavanagh, R. D.; Drinkwater, K. F.; Grant, S. M.; Heymans, J. J.; Hofmann, E. E.; Hunt, G. L.; Johnston, N. M. (2016). "Understanding the structure and functioning of polar pelagic ecosystems to predict the impacts of change". Proceedings of the Royal Society B: Biological Sciences. 283 (1844). doi:10.1098/rspb.2016.1646. PMC 5204148. PMID 27928038.
- Climate Impacts on Ecosystems: Food Web Disruptions EPA. Accessed 11 February 2020.
 This article incorporates text from this source, which is in the public domain.
- "A 'regime shift' is happening in the Arctic Ocean, scientists say". phys.org. Retrieved 16 August 2020.
- Lewis, K. M.; Dijken, G. L. van; Arrigo, K. R. (10 July 2020). "Changes in phytoplankton concentration now drive increased Arctic Ocean primary production". Science. 369 (6500): 198–202. doi:10.1126/science.aay8380. ISSN 0036-8075. PMID 32647002. S2CID 220433818. Retrieved 16 August 2020.
- Stoecker, D.K. and Lavrentyev, P.J. (2018). "Mixotrophic plankton in the polar seas: a pan-arctic review". Frontiers in Marine Science, 5: 292. doi:10.3389/fmars.2018.00292
- Kilias, Estelle S.; Junges, Leandro; Šupraha, Luka; Leonard, Guy; Metfies, Katja; Richards, Thomas A. (2020). "Chytrid fungi distribution and co-occurrence with diatoms correlate with sea ice melt in the Arctic Ocean". Communications Biology. 3 (1): 183. doi:10.1038/s42003-020-0891-7. PMC 7174370. PMID 32317738. S2CID 216033140.
 Modified text was copied from this source, which is available under a Creative Commons Attribution 4.0 International License.
- Bender, Sara J.; Moran, Dawn M.; McIlvin, Matthew R.; Zheng, Hong; McCrow, John P.; Badger, Jonathan; Ditullio, Giacomo R.; Allen, Andrew E.; Saito, Mak A. (2018). "Colony formation in Phaeocystis antarctica: Connecting molecular mechanisms with iron biogeochemistry". Biogeosciences. 15 (16): 4923–4942. Bibcode:2018BGeo...15.4923B. doi:10.5194/bg-15-4923-2018. S2CID 92529531.
- Pinkernell, Stefan; Beszteri, Bánk (2014). "Potential effects of climate change on the distribution range of the main silicate sinker of the Southern Ocean". Ecology and Evolution. 4 (16): 3147–3161. Bibcode:2014EcoEv...4.3147P. doi:10.1002/ece3.1138. PMC 4222203. PMID 25473469.
- Cavan, E. L.; Belcher, A.; Atkinson, A.; Hill, S. L.; Kawaguchi, S.; McCormack, S.; Meyer, B.; Nicol, S.; Ratnarajah, L.; Schmidt, K.; Steinberg, D. K.; Tarling, G. A.; Boyd, P. W. (2019). "The importance of Antarctic krill in biogeochemical cycles". Nature Communications. 10 (1): 4742. Bibcode:2019NatCo..10.4742C. doi:10.1038/s41467-019-12668-7. PMC 6800442. PMID 31628346..
 Modified text was copied from this source, which is available under a Creative Commons Attribution 4.0 International License.
- ^ Cordone, Georgina; Marina, Tomás I.; Salinas, Vanesa; Doyle, Santiago R.; Saravia, Leonardo A.; Momo, Fernando R. (2018). "Effects of macroalgae loss in an Antarctic marine food web: Applying extinction thresholds to food web studies". PeerJ. 6: e5531. doi:10.7717/peerj.5531. PMC 6139014. PMID 30225167.
- Marina, Tomás I.; Salinas, Vanesa; Cordone, Georgina; Campana, Gabriela; Moreira, Eugenia; Deregibus, Dolores; Torre, Luciana; Sahade, Ricardo; Tatián, Marcos; Barrera Oro, Esteban; De Troch, Marleen; Doyle, Santiago; Quartino, María Liliana; Saravia, Leonardo A.; Momo, Fernando R. (2018). "The Food Web of Potter Cove (Antarctica): Complexity, structure and function". Estuarine, Coastal and Shelf Science. 200: 141–151. Bibcode:2018ECSS..200..141M. doi:10.1016/j.ecss.2017.10.015. hdl:11336/39918.
- Koh, Eileen Y.; Martin, Andrew R.; McMinn, Andrew; Ryan, Ken G. (2012). "Recent Advances and Future Perspectives in Microbial Phototrophy in Antarctic Sea Ice". Biology. 1 (3): 542–556. doi:10.3390/biology1030542. PMC 4009807. PMID 24832507.
-
- Azam, F.; Fenchel, T.; Field, J. G.; Gray, J. S.; Meyer-Reil, L. A.; Thingstad, F. (1983). "The Ecological Role of Water-Column Microbes in the Sea". Marine Ecology Progress Series. 10 (3): 257–263. Bibcode:1983MEPS...10..257A. doi:10.3354/meps010257. JSTOR 24814647.
- Fenchel, Tom (2008). "The microbial loop – 25 years later". Journal of Experimental Marine Biology and Ecology. 366 (1–2): 99–103. Bibcode:2008JEMBE.366...99F. doi:10.1016/j.jembe.2008.07.013.
- ^ Boetius, Antje; Anesio, Alexandre M.; Deming, Jody W.; Mikucki, Jill A.; Rapp, Josephine Z. (2015). "Microbial ecology of the cryosphere: Sea ice and glacial habitats". Nature Reviews Microbiology. 13 (11): 677–690. doi:10.1038/nrmicro3522. PMID 26344407. S2CID 20798336.
- Rampelotto, Pabulo (2014). "Polar Microbiology: Recent Advances and Future Perspectives". Biology. 3 (1): 81–84. doi:10.3390/biology3010081. PMC 4009764.
- ^ Laybourn-Parry, Johanna (2009). "No Place Too Cold". Science. 324 (5934): 1521–1522. Bibcode:2009Sci...324.1521L. doi:10.1126/science.1173645. PMID 19541982. S2CID 33598792.
- Cavicchioli, Ricardo (2015). "Microbial ecology of Antarctic aquatic systems". Nature Reviews Microbiology. 13 (11): 691–706. doi:10.1038/nrmicro3549. hdl:1959.4/unsworks_49930. PMID 26456925. S2CID 23089203.
- ^ Anesio, Alexandre M.; Bellas, Christopher M. (2011). "Are low temperature habitats hot spots of microbial evolution driven by viruses?". Trends in Microbiology. 19 (2): 52–57. doi:10.1016/j.tim.2010.11.002. PMID 21130655.
- ^ Anesio, Alexandre M.; Laybourn-Parry, Johanna (2012). "Glaciers and ice sheets as a biome". Trends in Ecology & Evolution. 27 (4): 219–225. Bibcode:2012TEcoE..27..219A. doi:10.1016/j.tree.2011.09.012. PMID 22000675.
- ^ Ghiglione, J.-F.; Galand, P. E.; Pommier, T.; Pedros-Alio, C.; Maas, E. W.; Bakker, K.; Bertilson, S.; Kirchman, D. L.; Lovejoy, C.; Yager, P. L.; Murray, A. E. (2012). "Pole-to-pole biogeography of surface and deep marine bacterial communities". Proceedings of the National Academy of Sciences. 109 (43): 17633–17638. Bibcode:2012PNAS..10917633G. doi:10.1073/pnas.1208160109. PMC 3491513. PMID 23045668.
- Herron, Ellen M.; Dewey, John F.; Pitman, W. C. (1974). "Plate Tectonics Model for the Evolution of the Arctic". Geology. 2 (8): 377. Bibcode:1974Geo.....2..377H. doi:10.1130/0091-7613(1974)2<377:PTMFTE>2.0.CO;2. ISSN 0091-7613.
- Gaina, Carmen; Medvedev, Sergei; Torsvik, Trond H.; Koulakov, Ivan; Werner, Stephanie C. (2014). "4D Arctic: A Glimpse into the Structure and Evolution of the Arctic in the Light of New Geophysical Maps, Plate Tectonics and Tomographic Models". Surveys in Geophysics. 35 (5): 1095–1122. Bibcode:2014SGeo...35.1095G. doi:10.1007/s10712-013-9254-y. PMC 4456077. PMID 26069354.
- Kanao, Masaki; Suvorov, Vladimir D.; Toda, Shigeru; Tsuboi, Seiji (2015). "Seismicity, structure and tectonics in the Arctic region". Geoscience Frontiers. 6 (5): 665–677. Bibcode:2015GeoFr...6..665K. doi:10.1016/j.gsf.2014.11.002. S2CID 129578736.
- Adie, R.J. (1962) "The geology of Antarctica". In" Antarctic Research: The Matthew Fontaine Maury Memorial Symposium, John Wiley & Sons.
- Baldwin, AJ; Moss, JA; Pakulski, JD; Joux, F.; Jeffrey, WH (2005). "Microbial diversity in a Pacific Ocean transect from the Arctic to Antarctic circles". Aquatic Microbial Ecology. 41: 91–102. doi:10.3354/ame041091.
- López-Bueno, Alberto; Tamames, Javier; Velázquez, David; Moya, Andrés; Quesada, Antonio; Alcamí, Antonio (2009). "High Diversity of the Viral Community from an Antarctic Lake". Science. 326 (5954): 858–861. Bibcode:2009Sci...326..858L. doi:10.1126/science.1179287. PMID 19892985. S2CID 32607904.
- Säwström, Christin; Lisle, John; Anesio, Alexandre M.; Priscu, John C.; Laybourn-Parry, Johanna (2008). "Bacteriophage in polar inland waters". Extremophiles. 12 (2): 167–175. Bibcode:2008Extmo..12..167S. doi:10.1007/s00792-007-0134-6. PMID 18188502. S2CID 2927907.
- Lamy, T., Koenigs, C., Holbrook, S.J., Miller, R.J., Stier, A.C. and Reed, D.C. (2020) "Foundation species promote community stability by increasing diversity in a giant kelp forest". Ecology, e02987. doi:10.1002/ecy.2987.
- Dayton, P. K. 1972. Toward an understanding of community resilience and the potential effects of enrichments to the benthos at McMurdo Sound, Antarctica. pp. 81–96 in Proceedings of the Colloquium on Conservation Problems Allen Press, Lawrence, Kansas.
- Giant kelp gives Southern California marine ecosystems a strong foundation, National Science Foundation, 4 February 2020.
- Angelini, Christine; Altieri, Andrew H.; et al. (October 2011). "Interactions among Foundation Species and Their Consequences for Community Organization, Biodiversity, and Conservation". BioScience. 61 (10): 782–789. doi:10.1525/bio.2011.61.10.8.
- Ellison, Aaron M.; Bank, Michael S.; et al. (November 2005). "Loss of foundation species: consequences for the structure and dynamics of forested ecosystems". Frontiers in Ecology and the Environment. 3 (9): 479–486. doi:10.1890/1540-9295(2005)003[0479:LOFSCF]2.0.CO;2. hdl:11603/29165.
- Paine, R. T. (1969). "A Note on Trophic Complexity and Community Stability". The American Naturalist. 103 (929): 91–93. doi:10.1086/282586. JSTOR 2459472. S2CID 83780992.
- "Keystone Species Hypothesis". University of Washington. Archived from the original on 10 January 2011. Retrieved 3 February 2011.
- Paine, R. T. (1966). "Food web complexity and species diversity". American Naturalist. 100 (910): 65–75. doi:10.1086/282400. JSTOR 2459379. S2CID 85265656.
- Paine, R. T. (1995). "A Conversation on Refining the Concept of Keystone Species". Conservation Biology. 9 (4): 962–964. Bibcode:1995ConBi...9..962P. doi:10.1046/j.1523-1739.1995.09040962.x.
- Davic, Robert D. (2003). "Linking Keystone Species and Functional Groups: A New Operational Definition of the Keystone Species Concept". Conservation Ecology. Archived from the original on 26 August 2003. Retrieved 3 February 2011.
- Szpak, Paul; Orchard, Trevor J.; Salomon, Anne K.; Gröcke, Darren R. (2013). "Regional ecological variability and impact of the maritime fur trade on nearshore ecosystems in southern Haida Gwaii (British Columbia, Canada): evidence from stable isotope analysis of rockfish (Sebastes spp.) bone collagen". Archaeological and Anthropological Sciences. 5 (2): 159–182. Bibcode:2013ArAnS...5..159S. doi:10.1007/s12520-013-0122-y. S2CID 84866250.
- Cohn, J. P. (1998). "Understanding Sea Otters". BioScience. 48 (3): 151–155. doi:10.2307/1313259. JSTOR 1313259.
- ^ Endrédi, Anett; Patonai, Katalin; Podani, János; Libralato, Simone; Jordán, Ferenc (2021). "Who is Where in Marine Food Webs? A Trait-Based Analysis of Network Positions". Frontiers in Marine Science. 8. doi:10.3389/fmars.2021.636042. hdl:10831/110681.
 Modified text was copied from this source, which is available under a Creative Commons Attribution 4.0 International License.
- Lawton, John H. (1994). "What do Species do in Ecosystems?". Oikos. 71 (3): 367–374. Bibcode:1994Oikos..71..367L. doi:10.2307/3545824. JSTOR 3545824.
- Luczkovich, Joseph J.; Borgatti, Stephen P.; Johnson, Jeffrey C.; Everett, Martin G. (2003). "Defining and Measuring Trophic Role Similarity in Food Webs Using Regular Equivalence". Journal of Theoretical Biology. 220 (3): 303–321. Bibcode:2003JThBi.220..303L. doi:10.1006/jtbi.2003.3147. PMID 12468282.
- Paine, Robert T. (1966). "Food Web Complexity and Species Diversity". The American Naturalist. 100 (910): 65–75. doi:10.1086/282400. S2CID 38675566.
- Paine, Robert T. (1969). "The Pisaster-Tegula Interaction: Prey Patches, Predator Food Preference, and Intertidal Community Structure". Ecology. 50 (6): 950–961. Bibcode:1969Ecol...50..950P. doi:10.2307/1936888. JSTOR 1936888.
- Mills, L. Scott; Soulé, Michael E.; Doak, Daniel F. (1993). "The Keystone-Species Concept in Ecology and Conservation". BioScience. 43 (4): 219–224. doi:10.2307/1312122. JSTOR 1312122.
- Power, Mary E.; Tilman, David; Estes, James A.; Menge, Bruce A.; Bond, William J.; Mills, L. Scott; Daily, Gretchen; Castilla, Juan Carlos; Lubchenco, Jane; Paine, Robert T. (1996). "Challenges in the Quest for Keystones". BioScience. 46 (8): 609–620. Bibcode:1996BiSci..46..609P. doi:10.2307/1312990. JSTOR 1312990.
- Bond, W. J. (1994). "Keystone Species". Biodiversity and Ecosystem Function. pp. 237–253. doi:10.1007/978-3-642-58001-7_11. ISBN 978-3-540-58103-1.
- Marcogliese, David J.; Cone, David K. (1997). "Food webs: A plea for parasites". Trends in Ecology & Evolution. 12 (8): 320–325. Bibcode:1997TEcoE..12..320M. doi:10.1016/s0169-5347(97)01080-x. PMID 21238094.
- Pinnegar, John.K; Polunin, Nicholas V.C (2004). "Predicting indirect effects of fishing in Mediterranean rocky littoral communities using a dynamic simulation model". Ecological Modelling. 172 (2–4): 249–267. Bibcode:2004EcMod.172..249P. doi:10.1016/J.ECOLMODEL.2003.09.010.
- Jordán, Ferenc; Benedek, Zsófia; Podani, János (2007). "Quantifying positional importance in food webs: A comparison of centrality indices". Ecological Modelling. 205 (1–2): 270–275. Bibcode:2007EcMod.205..270J. doi:10.1016/j.ecolmodel.2007.02.032.
- Endrédi, Anett; Senánszky, Vera; Libralato, Simone; Jordán, Ferenc (2018). "Food web dynamics in trophic hierarchies". Ecological Modelling. 368: 94–103. Bibcode:2018EcMod.368...94E. doi:10.1016/j.ecolmodel.2017.11.015.
- Scotti, M.; Jordán, F. (2010). "Relationships between centrality indices and trophic levels in food webs". Community Ecology. 11 (1): 59–67. Bibcode:2010ComEc..11...59S. doi:10.1556/comec.11.2010.1.9.
- Baranyi, Gabriella; Saura, Santiago; Podani, János; Jordán, Ferenc (2011). "Contribution of habitat patches to network connectivity: Redundancy and uniqueness of topological indices". Ecological Indicators. 11 (5): 1301–1310. Bibcode:2011EcInd..11.1301B. doi:10.1016/j.ecolind.2011.02.003.
- Pereira, Juliana; Saura, Santiago; Jordán, Ferenc (2017). "Single-node vs. Multi-node centrality in landscape graph analysis: Key habitat patches and their protection for 20 bird species in NE Spain". Methods in Ecology and Evolution. 8 (11): 1458–1467. Bibcode:2017MEcEv...8.1458P. doi:10.1111/2041-210X.12783. S2CID 90319704.
- ^ Millette, N.C., Grosse, J., Johnson, W.M., Jungbluth, M.J. and Suter, E.A. (2018). "Hidden in plain sight: The importance of cryptic interactions in marine plankton". Limnology and Oceanography Letters, 3(4): 341–356. doi:10.1002/lol2.10084.
 Modified text was copied from this source, which is available under a Creative Commons Attribution 4.0 International License.
- ^ Luypaert, Thomas; Hagan, James G.; McCarthy, Morgan L.; Poti, Meenakshi (2020). Jungblut, Simon; Liebich, Viola; Bode-Dalby, Maya (eds.). Status of Marine Biodiversity in the Anthropocene. Cham: Springer International Publishing. pp. 57–82. doi:10.1007/978-3-030-20389-4_4. ISBN 978-3-030-20388-7.
- Estes JA, Tinker MT, Williams TM et al. (1998) "Killer whale predation on sea otters linking oceanic and nearshore ecosystems". Science, 282: 473–476. doi:10.1126/science.282.5388.473.
- Post, D. M. (1993). "The long and short of food-chain length". Trends in Ecology and Evolution. 17 (6): 269–277. doi:10.1016/S0169-5347(02)02455-2.
- Jerry Bobrow, Ph.D.; Stephen Fisher (2009). CliffsNotes CSET: Multiple Subjects (2nd ed.). John Wiley and Sons. p. 283. ISBN 978-0-470-45546-3.
- Elton CS (1927) Animal Ecology. Republished 2001. University of Chicago Press.
- Paine RT (1966). "Food web complexity and species diversity". The American Naturalist. 100 (910): 65–75. doi:10.1086/282400. S2CID 85265656.
- ^ May RM (2001) Stability and Complexity in Model Ecosystems Princeton University Press, reprint of 1973 edition with new foreword. ISBN 978-0-691-08861-7.
- ^ Pimm SL (2002) Food Webs University of Chicago Press, reprint of 1982 edition with new foreword. ISBN 978-0-226-66832-1.
- Kotta, J.; Wernberg, T.; Jänes, H.; Kotta, I.; Nurkse, K.; Pärnoja, M.; Orav-Kotta, H. (2018). "Novel crab predator causes marine ecosystem regime shift". Scientific Reports. 8 (1): 4956. Bibcode:2018NatSR...8.4956K. doi:10.1038/s41598-018-23282-w. PMC 5897427. PMID 29651152.
- Megrey, Bernard and Werner, Francisco. "Evaluating the Role of Topdown vs. Bottom-up Ecosystem Regulation from a Modeling Perspective" (PDF).
{{cite web}}: CS1 maint: multiple names: authors list (link) - Frank, K. T.; Petrie, B.; Choi, J. S.; Leggett, W. C. (2005). "Trophic Cascades in a Formerly Cod-Dominated Ecosystem". Science. 308 (5728): 1621–1623. Bibcode:2005Sci...308.1621F. doi:10.1126/science.1113075. ISSN 0036-8075. PMID 15947186. S2CID 45088691.
- Matsuzaki, Shin-Ichiro S.; Suzuki, Kenta; Kadoya, Taku; Nakagawa, Megumi; Takamura, Noriko (2018). "Bottom-up linkages between primary production, zooplankton, and fish in a shallow, hypereutrophic lake". Ecology. 99 (9): 2025–2036. Bibcode:2018Ecol...99.2025M. doi:10.1002/ecy.2414. PMID 29884987. S2CID 46996957.
- Lynam, Christopher Philip; Llope, Marcos; Möllmann, Christian; Helaouët, Pierre; Bayliss-Brown, Georgia Anne; Stenseth, Nils C. (February 2017). "Trophic and environmental control in the North Sea". Proceedings of the National Academy of Sciences. 114 (8): 1952–1957. doi:10.1073/pnas.1621037114. PMC 5338359. PMID 28167770.
- "Oldlist". Rocky Mountain Tree Ring Research. Retrieved 8 January 2013.
- U S Department of Energy (2008) Carbon Cycling and Biosequestration page 81, Workshop report DOE/SC-108, U.S. Department of Energy Office of Science.
- Wetzel, Robert (2001). Limnology: Lake and river ecosystems. San Diego: Academic Press. ISBN 9780127447605.
- ^ Field, C. B.; Behrenfeld, M. J.; Randerson, J. T.; Falkowski, P. (1998). "Primary Production of the Biosphere: Integrating Terrestrial and Oceanic Components". Science. 281 (5374): 237–240. Bibcode:1998Sci...281..237F. doi:10.1126/science.281.5374.237. PMID 9657713.
- Bar-On, Y.M., Phillips, R. and Milo, R. (2018) "The biomass distribution on Earth". Proceedings of the National Academy of Sciences, 115(25): 6506–6511. doi:10.1073/pnas.1711842115.
- Spellman, Frank R. (2008). The Science of Water: Concepts and Applications. CRC Press. p. 167. ISBN 978-1-4200-5544-3.
- Odum, E. P.; Barrett, G. W. (2005). Fundamentals of Ecology (5th ed.). Brooks/Cole, a part of Cengage Learning. ISBN 978-0-534-42066-6. Archived from the original on 20 August 2011.
- Wang, H.; Morrison, W.; Singh, A.; Weiss, H. (2009). "Modeling inverted biomass pyramids and refuges in ecosystems" (PDF). Ecological Modelling. 220 (11): 1376–1382. Bibcode:2009EcMod.220.1376W. doi:10.1016/j.ecolmodel.2009.03.005. Archived from the original (PDF) on 7 October 2011. Retrieved 18 March 2020.
- Smith, S. V. (1981). "Marine Macrophytes as a Global Carbon Sink". Science. 211 (4484): 838–840. Bibcode:1981Sci...211..838S. doi:10.1126/science.211.4484.838. PMID 17740399.
- Maureaud, A., Gascuel, D., Colléter, M., Palomares, M.L., Du Pontavice, H., Pauly, D. and Cheung, W.W. (2017) "Global change in the trophic functioning of marine food webs". PLOS ONE, 12(8): e0182826. doi:10.1371/journal.pone.0182826
- "Effects of Ocean Acidification on Marine Species & Ecosystems". Report. OCEANA. Archived from the original on 25 December 2014. Retrieved 13 October 2013.
- "Comprehensive study of Arctic Ocean acidification". Study. CICERO. Archived from the original on 10 December 2013. Retrieved 14 November 2013.
- Lischka, S.; Büdenbender J.; Boxhammer T.; Riebesell U. (15 April 2011). "Impact of ocean acidification and elevated temperatures on early juveniles of the polar shelled pteropod Limacina helicina : mortality, shell degradation, and shell growth" (PDF). Report. Biogeosciences. pp. 919–932. Retrieved 14 November 2013.
- "Antarctic marine wildlife is under threat, study finds". BBC Nature. Retrieved 13 October 2013.
- ^ Tekwa, E. W., J.R. Watson., M. L. Pinsky. "Body Size and Food–Web Interactions Mediate Species Range Shifts under Warming." Proceedings of the Royal Society B: Biological Sciences, vol. 289, no. 1972, 2022, https://doi.org/10.1098/rspb.2021.2755.
- Chapman, Eric J., C.J. Byron., R. Lasley-Rasher., C. Lipsky., J.R. Stevens., R. Peters. "Effects of Climate Change on Coastal Ecosystem Food Webs: Implications for Aquaculture." Marine Environmental Research, vol. 162, 2020, p. 105103., https://doi.org/10.1016/j.marenvres.2020.105103
- "Climate Change Impacts on the Ocean and Marine Resources." EPA, Environmental Protection Agency
- "Climate Change Indicators: Marine Species Distribution." EPA, Environmental Protection Agency
- NOAA (National Oceanic and Atmospheric Administration) and Rutgers University. 2021. OceanAdapt. Accessed January 2021
- Pinsky, Malin L., B. Worm., M.J. Forgarty., J.L. Sarmiento., S.A. Levin . "Marine Taxa Track Local Climate Velocities." Science, vol. 341, no. 6151, 2013, pp. 1239–1242.,
- Ullah, Hadayet; Nagelkerken, Ivan; Goldenberg, Silvan U.; Fordham, Damien A. (9 January 2018). Loreau, Michel (ed.). "Climate change could drive marine food web collapse through altered trophic flows and cyanobacterial proliferation". PLOS Biology. 16 (1): e2003446. doi:10.1371/journal.pbio.2003446. ISSN 1545-7885. PMC 5760012. PMID 29315309.
- ^ Climate change drives collapse in marine food webs ScienceDaily. 9 January 2018.
- IUCN (2018) The IUCN Red List of Threatened Species: Version 2018-1

 is the fractional trophic level of the prey j, and
  represents the fraction of j in the diet of i. In the case of marine ecosystems, the trophic level of most fish and other marine consumers takes value between
2.0 and 5.0. The upper value, 5.0, is unusual, even for large fish, though it occurs in apex predators of marine mammals, such as polar bears and killer whales. As a point of contrast, humans have a mean trophic level of about 2.21, about the same as a pig or an anchovy.
