Parish municipality in Quebec, Canada
| Saint-Donat | |
|---|---|
| Parish municipality | |
 | |
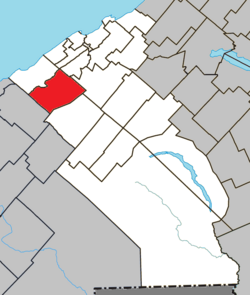
 Location within La Mitis RCM Location within La Mitis RCM | |
 | |
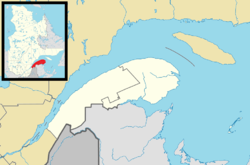
| Coordinates: 48°29′49″N 68°14′56″W / 48.4970265°N 68.2488766°W / 48.4970265; -68.2488766 | |
| Country | |
| Province | |
| Region | Bas-Saint-Laurent |
| RCM | La Mitis |
| Constituted | March 10, 1869 |
| Government | |
| • Mayor | Pascal Rioux |
| • Federal riding | Haute-Gaspésie—La Mitis—Matane—Matapédia |
| • Prov. riding | Matane-Matapédia |
| Area | |
| • Total | 95.30 km (36.80 sq mi) |
| • Land | 95.80 km (36.99 sq mi) |
| Population | |
| • Total | 835 |
| • Density | 8.7/km (23/sq mi) |
| • Pop 2016-2021 | |
| • Dwellings | 478 |
| Time zone | UTC−5 (EST) |
| • Summer (DST) | UTC−4 (EDT) |
| Postal code(s) | G0K 1L0 |
| Area code(s) | 418 and 581 |
| Highways | |
| Website | www |
Saint-Donat is a parish municipality in La Mitis Regional County Municipality in the Bas-Saint-Laurent region of Quebec, Canada. Its population in the Canada 2021 Census was 835.
History
Saint-Donat was originally a sector of Sainte-Luce. Saint-Donat split from Sainte-Luce in 1869 to became the parish municipality of Saint-Donat. The original economic vocation of Saint-Donat was based almost entirely on forestry, as evidenced by the many remnants of the sawmills that once dotted the area. Later, like many other towns in the region, agriculture became the main activity.
Demographics
In the 2021 Census of Population conducted by Statistics Canada, Saint-Donat had a population of 835 living in 400 of its 478 total private dwellings, a change of -4.7% from its 2016 population of 876. With a land area of 95.8 km (37.0 sq mi), it had a population density of 8.7/km (22.6/sq mi) in 2021.
Population
Population trend:
| Census | Population | Change (%) |
|---|---|---|
| 2021 | 835 | |
| 2016 | 876 | |
| 2011 | 890 | |
| 2006 | 892 | |
| 2001 | 847 | |
| 1996 | 812 | |
| 1991 | 760 | |
| 1986 | 833 | |
| 1981 | 841 | |
| 1976 | 761 | |
| 1971 | 865 | |
| 1966 | 986 | |
| 1961 | 1,122 | |
| 1956 | 1,192 | |
| 1951 | 1,122 | |
| 1941 | 1,283 | |
| 1931 | 1,347 | |
| 1921 | 1,189 | |
| 1911 | 922 | |
| 1901 | 802 | |
| 1891 | 760 | |
| 1881 | 914 | |
| 1871 | 819 | N/A |
Language
Mother tongue language (2021)
| Language | Population | Pct (%) |
|---|---|---|
| French only | 825 | 98.8% |
| English only | 5 | 0.6% |
| Both English and French | 10 | 1.2% |
| Other languages | 0 | 0.0% |
See also
References
- ^ "Banque de noms de lieux du Québec: Reference number 55936". toponymie.gouv.qc.ca (in French). Commission de toponymie du Québec.
- ^ "Répertoire des municipalités: Geographic code 09030". www.mamh.gouv.qc.ca (in French). Ministère des Affaires municipales et de l'Habitation.
- ^ "Census Profile, 2021 Census, Statistics Canada - Validation Error".
- "Population and dwelling counts: Canada, provinces and territories, and census subdivisions (municipalities), Quebec". Statistics Canada. February 9, 2022. Retrieved August 29, 2022.
- Statistics Canada: 1996, 2001, 2011 census
- 2021 Statistics Canada Community Profile: Saint-Donat, Quebec
External links
 Media related to Saint-Donat, Bas-Saint-Laurent, Quebec at Wikimedia Commons
| Adjacent Municipal Subdivisions | ||||||||||||||||
|---|---|---|---|---|---|---|---|---|---|---|---|---|---|---|---|---|
| ||||||||||||||||
| Cities & towns | |
|---|---|
| Municipalities | |
| Parishes | |
| Villages | |
| Unorganized territories | |
| |
This Bas-Saint-Laurent location article is a stub. You can help Misplaced Pages by expanding it. |