Main article: 2004 United States presidential election
| ||||||||||||||||||||||||||
| ||||||||||||||||||||||||||
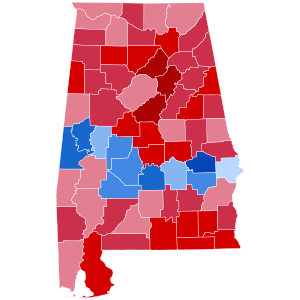
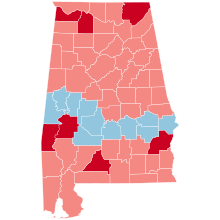
 County Results County Results
| ||||||||||||||||||||||||||
| ||||||||||||||||||||||||||
The 2004 United States presidential election in Alabama took place on November 2, 2004. Voters chose nine representatives, or electors, to the Electoral College, who voted for president and vice president.
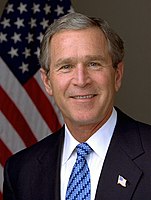
Alabama was won by incumbent President George W. Bush by a 25.62% margin of victory. Prior to the election, all 12 news organizations considered this was a state Bush would win, or otherwise a red state. On election day, it trended Republican sharply, by a swing margin of 10.74% from the 2000 election. Bush won with over 60% of the vote, a first since 1984, and carried most of the counties and congressional districts. Historically, Alabama is a very reliable Republican state that a Democratic presidential nominee has not won since 1976, when Southern governor of Georgia Jimmy Carter ran and swept the Deep South.
Primaries
Campaign
Predictions
There were 12 news organizations who made state-by-state predictions of the election. Here are their last predictions before election day.
| Source | Ranking |
|---|---|
| D.C. Political Report | Solid R |
| Associated Press | Solid R |
| CNN | Likely R |
| Cook Political Report | Solid R |
| Newsweek | Solid R |
| New York Times | Solid R |
| Rasmussen Reports | Likely R |
| Research 2000 | Solid R |
| Washington Post | Likely R |
| Washington Times | Solid R |
| Zogby International | Likely R |
| Washington Dispatch | Likely R |
Polling
Main article: Statewide opinion polling for the 2004 United States presidential election: AlabamaBush won every single pre-election poll, and won each by a double-digit margin of victory. The final three polls averaged Bush leading 58% to 38%.
Fundraising
Bush raised $3,092,923. Kerry raised $514,589.
Advertising and visits
Neither campaign advertised or visited this state during the fall campaign.
Analysis
Bush easily won every poll taken in the state prior to the election. Kerry won a small section of counties in the middle of the state, including winning Alabama's 7th congressional district. In 2000, the state voted for Bush 56%–41% by fifteen points; this year it voted for him by 25 points.
With the exception of Oklahoma in 2004, the state was also Bush's best performance in the South, with not even Texas, Bush's home state, voting as red as Alabama.
CNN exit polls showed that almost 70% of male voters voted for Bush as did 99% of registered Republicans (which made up 48% of the population). 43% of the state describe themselves as evangelical Christians, and 88% of them voted for Bush. 62% of the state approved of Bush, and 60% approved of the decision to go to war in Iraq. 82% of white men and 79% of white women voted for Bush. Finally, 70% of voters over the age of 60 voted for Bush. Alabama was racially divided: Alabama Whites voted 80%–19% for Bush while Blacks voted 91%-9% for Kerry.
As of the 2024 presidential election, Bush is the last Republican to carry Jefferson County (home of Birmingham, the state's largest city) in a presidential election. Majority-black Marengo County wouldn't vote Republican again until 2024.
Results
| 2004 United States presidential election in Alabama | |||||
|---|---|---|---|---|---|
| Party | Candidate | Votes | Percentage | Electoral votes | |
| Republican | George W. Bush (incumbent) | 1,176,394 | 62.46% | 9 | |
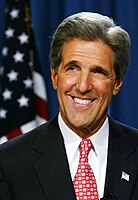
| Democratic | John Kerry | 693,933 | 36.84% | 0 | |
| Independent | Ralph Nader | 6,701 | 0.35% | 0 | |
| Independent | Michael Badnarik | 3,529 | 0.19% | 0 | |
| Independent | Michael Peroutka | 1,994 | 0.11% | 0 | |
| Write Ins | 898 | 0.05% | 0 | ||
| Totals | 1,883,449 | 100.00% | 9 | ||
| Voter turnout (voting-age population) | 55.5% | ||||
By county
| County | George W. Bush Republican |
John Kerry Democratic |
Various candidates Other parties |
Margin | Total | ||||
|---|---|---|---|---|---|---|---|---|---|
| # | % | # | % | # | % | # | % | ||
| Autauga | 15,196 | 75.67% | 4,758 | 23.69% | 127 | 0.63% | 10,438 | 51.98% | 20,081 |
| Baldwin | 52,971 | 76.42% | 15,599 | 22.50% | 750 | 1.09% | 37,372 | 53.92% | 69,320 |
| Barbour | 5,899 | 54.74% | 4,832 | 44.84% | 46 | 0.43% | 1,067 | 9.90% | 10,777 |
| Bibb | 5,472 | 72.00% | 2,089 | 27.49% | 39 | 0.51% | 3,383 | 44.51% | 7,600 |
| Blount | 17,386 | 80.85% | 3,938 | 18.31% | 180 | 0.84% | 13,448 | 62.54% | 21,504 |
| Bullock | 1,494 | 31.67% | 3,210 | 68.05% | 13 | 0.28% | -1,716 | -36.38% | 4,717 |
| Butler | 4,979 | 59.16% | 3,413 | 40.55% | 24 | 0.29% | 1,566 | 18.61% | 8,416 |
| Calhoun | 29,814 | 65.89% | 15,083 | 33.33% | 352 | 0.78% | 14,731 | 32.56% | 45,249 |
| Chambers | 7,622 | 58.49% | 5,347 | 41.03% | 63 | 0.48% | 2,275 | 17.46% | 13,032 |
| Cherokee | 5,923 | 65.45% | 3,040 | 33.59% | 86 | 0.96% | 2,883 | 31.86% | 9,049 |
| Chilton | 12,829 | 76.85% | 3,778 | 22.63% | 86 | 0.52% | 9,051 | 54.22% | 16,693 |
| Choctaw | 3,897 | 53.92% | 3,303 | 45.70% | 27 | 0.37% | 594 | 8.22% | 7,227 |
| Clarke | 6,730 | 59.07% | 4,627 | 40.61% | 37 | 0.32% | 2,103 | 18.46% | 11,394 |
| Clay | 4,624 | 70.32% | 1,893 | 28.79% | 59 | 0.90% | 2,731 | 41.53% | 6,576 |
| Cleburne | 4,370 | 75.37% | 1,391 | 23.99% | 37 | 0.63% | 2,979 | 51.38% | 5,798 |
| Coffee | 13,019 | 73.90% | 4,480 | 25.43% | 117 | 0.66% | 8,539 | 48.47% | 17,616 |
| Colbert | 13,188 | 55.10% | 10,598 | 44.28% | 149 | 0.62% | 2,590 | 10.82% | 23,935 |
| Conecuh | 3,271 | 54.33% | 2,719 | 45.16% | 31 | 0.51% | 552 | 9.17% | 6,021 |
| Coosa | 2,905 | 58.09% | 2,055 | 41.09% | 41 | 0.82% | 850 | 17.00% | 5,001 |
| Covington | 11,119 | 76.02% | 3,423 | 23.40% | 85 | 0.58% | 7,696 | 52.62% | 14,627 |
| Crenshaw | 3,777 | 68.67% | 1,698 | 30.87% | 25 | 0.46% | 2,079 | 37.80% | 5,500 |
| Cullman | 26,818 | 76.21% | 8,045 | 22.86% | 328 | 0.93% | 18,773 | 53.35% | 35,191 |
| Dale | 13,621 | 74.71% | 4,484 | 24.60% | 126 | 0.69% | 9,137 | 50.11% | 18,231 |
| Dallas | 7,335 | 39.49% | 11,175 | 60.17% | 63 | 0.34% | -3,840 | -20.68% | 18,573 |
| DeKalb | 16,904 | 69.94% | 7,092 | 29.34% | 173 | 0.72% | 9,812 | 40.60% | 24,169 |
| Elmore | 22,056 | 76.90% | 6,471 | 22.56% | 153 | 0.53% | 15,585 | 54.34% | 28,680 |
| Escambia | 8,513 | 68.68% | 3,814 | 30.77% | 68 | 0.55% | 4,699 | 37.91% | 12,395 |
| Etowah | 26,999 | 63.26% | 15,328 | 35.91% | 353 | 0.83% | 11,671 | 27.35% | 42,680 |
| Fayette | 5,534 | 69.16% | 2,408 | 30.09% | 60 | 0.74% | 3,126 | 39.07% | 8,002 |
| Franklin | 7,690 | 62.68% | 4,514 | 36.79% | 65 | 0.53% | 3,176 | 25.89% | 12,269 |
| Geneva | 8,342 | 79.30% | 2,113 | 20.09% | 65 | 0.62% | 6,229 | 59.21% | 10,520 |
| Greene | 958 | 20.18% | 3,764 | 79.28% | 26 | 0.54% | -2,806 | -59.10% | 4,748 |
| Hale | 3,281 | 41.30% | 4,631 | 58.29% | 33 | 0.42% | -1,350 | -16.99% | 7,945 |
| Henry | 4,881 | 66.31% | 2,452 | 33.31% | 28 | 0.38% | 2,429 | 33.00% | 7,361 |
| Houston | 26,874 | 74.24% | 9,144 | 25.26% | 183 | 0.50% | 17,730 | 48.98% | 36,201 |
| Jackson | 11,534 | 56.76% | 8,635 | 42.49% | 152 | 0.75% | 2,899 | 14.27% | 20,321 |
| Jefferson | 158,680 | 54.16% | 132,286 | 45.15% | 2,001 | 0.68% | 26,394 | 9.01% | 292,967 |
| Lamar | 4,894 | 71.08% | 1,956 | 28.41% | 35 | 0.51% | 2,938 | 42.67% | 6,885 |
| Lauderdale | 22,161 | 59.72% | 14,628 | 39.42% | 318 | 0.86% | 7,533 | 20.30% | 37,107 |
| Lawrence | 7,730 | 55.21% | 6,155 | 43.96% | 116 | 0.82% | 1,575 | 11.25% | 14,001 |
| Lee | 27,972 | 62.70% | 16,227 | 36.38% | 411 | 0.92% | 11,745 | 26.32% | 44,610 |
| Limestone | 19,702 | 67.77% | 9,126 | 31.39% | 245 | 0.84% | 10,576 | 36.38% | 29,073 |
| Lowndes | 1,786 | 29.66% | 4,233 | 70.30% | 2 | 0.03% | -2,447 | -40.64% | 6,021 |
| Macon | 1,570 | 16.69% | 7,800 | 82.92% | 37 | 0.39% | -6,230 | -66.23% | 9,407 |
| Madison | 77,173 | 58.88% | 52,644 | 40.17% | 1,245 | 0.95% | 24,529 | 18.71% | 131,062 |
| Marengo | 5,255 | 50.91% | 5,037 | 48.80% | 30 | 0.29% | 218 | 2.11% | 10,322 |
| Marion | 8,983 | 69.77% | 3,808 | 29.58% | 84 | 0.65% | 5,175 | 40.19% | 12,875 |
| Marshall | 22,783 | 72.35% | 8,452 | 26.84% | 256 | 0.81% | 14,331 | 45.51% | 31,491 |
| Mobile | 92,014 | 58.69% | 63,732 | 40.65% | 1,025 | 0.65% | 28,282 | 18.04% | 156,771 |
| Monroe | 5,831 | 61.16% | 3,666 | 38.45% | 37 | 0.39% | 2,165 | 22.71% | 9,534 |
| Montgomery | 44,097 | 49.19% | 45,160 | 50.37% | 393 | 0.44% | -1,063 | -1.18% | 89,650 |
| Morgan | 32,477 | 69.09% | 14,131 | 30.06% | 399 | 0.85% | 18,346 | 39.03% | 47,007 |
| Perry | 1,738 | 31.47% | 3,767 | 68.21% | 18 | 0.33% | -2,029 | -36.74% | 5,523 |
| Pickens | 5,170 | 56.61% | 3,915 | 42.87% | 47 | 0.51% | 1,255 | 13.74% | 9,132 |
| Pike | 7,483 | 62.97% | 4,334 | 36.47% | 66 | 0.56% | 3,149 | 26.50% | 11,883 |
| Randolph | 6,127 | 68.07% | 2,817 | 31.30% | 57 | 0.63% | 3,310 | 36.77% | 9,001 |
| Russell | 8,337 | 49.60% | 8,375 | 49.82% | 97 | 0.57% | -38 | -0.22% | 16,809 |
| Shelby | 63,435 | 80.39% | 14,850 | 18.82% | 621 | 0.79% | 48,585 | 61.57% | 78,906 |
| St. Clair | 23,500 | 80.59% | 5,456 | 18.71% | 205 | 0.70% | 18,044 | 61.88% | 29,161 |
| Sumter | 1,880 | 29.22% | 4,527 | 70.37% | 26 | 0.40% | -2,647 | -41.15% | 6,433 |
| Talladega | 18,331 | 61.31% | 11,374 | 38.04% | 193 | 0.65% | 6,957 | 23.27% | 29,898 |
| Tallapoosa | 12,392 | 69.03% | 5,451 | 30.36% | 109 | 0.61% | 6,941 | 38.67% | 17,952 |
| Tuscaloosa | 42,877 | 61.40% | 26,447 | 37.87% | 506 | 0.73% | 16,430 | 23.53% | 69,830 |
| Walker | 19,167 | 67.57% | 9,016 | 31.78% | 184 | 0.65% | 10,151 | 35.79% | 28,367 |
| Washington | 5,060 | 61.36% | 3,145 | 38.14% | 42 | 0.51% | 1,915 | 23.22% | 8,247 |
| Wilcox | 1,834 | 32.28% | 3,838 | 67.55% | 10 | 0.18% | -2,004 | -35.27% | 5,682 |
| Winston | 8,130 | 78.00% | 2,236 | 21.45% | 57 | 0.55% | 5,894 | 56.55% | 10,423 |
| Totals | 1,176,394 | 62.46% | 693,933 | 36.84% | 13,122 | 0.70% | 482,461 | 25.62% | 1,883,449 |
Counties that flipped from Democratic to Republican
- Barbour (Largest city: Eufaula)
- Choctaw (Largest city: Butler)
- Colbert (Largest city: Muscle Shoals)
- Conecuh (Largest city: Evergreen)
- Jackson (Largest city: Scottsboro)
- Lawrence (Largest city: Moulton)
- Marengo (Largest city: Linden)
By congressional district
Bush won 6 of 7 congressional districts, including one held by a Democrat.
| District | Bush | Kerry | Representative | |
|---|---|---|---|---|
| 1st | 
|
64% | 35% | Jo Bonner |
| 2nd | 
|
67% | 33% | Terry Everett |
| 3rd | 
|
58% | 41% | Mike D. Rogers |
| 4th | 
|
71% | 28% | Robert Aderholt |
| 5th | 
|
60% | 39% | Bud Cramer |
| 6th | 
|
78% | 22% | Spencer Bachus |
| 7th | 
|
35% | 64% | Artur Davis |
Electors
Main article: List of 2004 United States presidential electorsTechnically the voters of Alabama cast their ballots for electors: representatives to the Electoral College. Alabama is allocated 9 electors because it has 7 congressional districts and 2 senators. All candidates who appear on the ballot or qualify to receive write-in votes must submit a list of 9 electors, who pledge to vote for their candidate and his or her running mate. Whoever wins the majority of votes in the state is awarded all 9 electoral votes. Their chosen electors then vote for president and vice president. Although electors are pledged to their candidate and running mate, they are not obligated to vote for them. An elector who votes for someone other than his or her candidate is known as a faithless elector.
The electors of each state and the District of Columbia met on December 13, 2004, to cast their votes for president and vice president. The Electoral College itself never meets as one body. Instead the electors from each state and the District of Columbia met in their respective capitols.
The following were the members of the Electoral College from the state. All were pledged to and voted for George W. Bush and Dick Cheney.
- Beth Chapman
- Marty Connors
- Martha Hosey
- Will Sellers
- Mike Hubbard
- Floyd Lawson
- Elbert Peters
- Bettye Fine Collins
- Martha Stokes
See also
References
- "Archived copy". dcpoliticalreport.com. Archived from the original on November 21, 2010. Retrieved January 13, 2022.
{{cite web}}: CS1 maint: archived copy as title (link) - ^ "Election 2004 Polls - Dave Leip's Atlas of U.S. Presidential Elections". Uselectionatlas.org. Retrieved October 8, 2014.
- "George W Bush - $374,659,453 raised, '04 election cycle, Republican Party, President". Campaignmoney.com. Retrieved October 8, 2014.
- "John F Kerry - $345,826,176 raised, '04 election cycle, Democratic Party, President". Campaignmoney.com. Retrieved October 8, 2014.
- "CNN.com Specials". Cnn.com. Retrieved October 8, 2014.
- "CNN.com Specials". Cnn.com. Retrieved October 8, 2014.
- "CNN.com Election 2004". Cnn.com. Retrieved October 8, 2014.
- Archived May 13, 2009, at the Wayback Machine
- "Swing State Project". Swingstateproject.com. December 15, 2008. Retrieved October 8, 2014.
- Archived March 26, 2009, at the Wayback Machine
- "Dave Leip's Atlas of U.S. Presidential Elections". Uselectionatlas.org. Retrieved October 8, 2014.
| State and district results of the 2004 United States presidential election | ||
|---|---|---|
|  | |


