Main article: 1876 United States presidential election
| ||||||||||||||||||||||||||
| ||||||||||||||||||||||||||
 County Results County Results
| ||||||||||||||||||||||||||
| ||||||||||||||||||||||||||
The 1876 United States presidential election in Nevada took place on November 7, 1876, as part of the 1876 United States presidential election. Voters chose three representatives, or electors to the Electoral College, who voted for president and vice president.
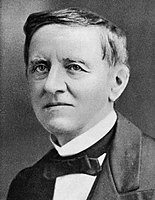
Nevada voted for the Republican nominee, Rutherford B. Hayes, over the Democratic nominee, Samuel J. Tilden. Hayes won the state by a margin of 5.46%.
Results
| Party | Pledged to | Elector | Votes | |
|---|---|---|---|---|
| Republican Party | Rutherford B. Hayes | George Tufly | 10,383 | |
| Republican Party | Rutherford B. Hayes | W. W. Bishop | 10,369 | |
| Republican Party | Rutherford B. Hayes | R. M. Daggett | 10,360 | |
| Democratic Party | Samuel J. Tilden | J. C. Currie | 9,308 | |
| Democratic Party | Samuel J. Tilden | E. Blennerhasset | 9,294 | |
| Democratic Party | Samuel J. Tilden | J. C. Hagerman | 9,291 | |
| Votes cast | 19,691 | |||
Results by county
| Rutherford B. Hayes Republican |
Samuel J. Tilden Democratic |
Margin | Total votes cast | ||||
|---|---|---|---|---|---|---|---|
| County | # | % | # | % | # | % | |
| Churchill | 34 | 42.50% | 46 | 57.50% | -12 | -15.00% | 80 |
| Douglas | 332 | 64.97% | 179 | 35.03% | 153 | 29.94% | 511 |
| Elko | 763 | 48.20% | 820 | 51.80% | -57 | -3.60% | 1,583 |
| Esmeralda | 370 | 49.80% | 373 | 50.20% | -3 | -0.40% | 743 |
| Eureka | 779 | 50.32% | 769 | 49.68% | 10 | 0.65% | 1,548 |
| Humboldt | 394 | 44.07% | 500 | 55.93% | -106 | -11.86% | 894 |
| Lander | 380 | 41.99% | 525 | 58.01% | -145 | -16.02% | 905 |
| Lincoln | 359 | 47.74% | 393 | 52.26% | -34 | -4.52% | 752 |
| Lyon | 533 | 63.60% | 305 | 36.40% | 228 | 27.21% | 838 |
| Nye | 429 | 49.60% | 436 | 50.40% | -7 | -0.81% | 865 |
| Ormsby | 844 | 62.52% | 506 | 37.48% | 338 | 25.04% | 1,350 |
| Storey | 3,692 | 53.37% | 3,226 | 46.63% | 466 | 6.74% | 6,918 |
| Washoe | 906 | 57.78% | 662 | 42.22% | 244 | 15.56% | 1,568 |
| White Pine | 568 | 50.00% | 568 | 50.00% | 0 | 0.00% | 1,136 |
| Totals | 10,383 | 52.73% | 9,308 | 47.27% | 1,075 | 5.46% | 19,691 |
Counties that flipped from Republican to Democratic
See also
Notes
- Based on totals for highest elector on each ticket
- Based on highest elector on each ticket
References
- Nevada State Archives, Canvass of votes cast at the general election held in the State of Nevada on the 7th day of November A.D. 1876 for Presidential Electors
| State and district results of the 1876 United States presidential election | ||
|---|---|---|
|  | |
This Nevada elections-related article is a stub. You can help Misplaced Pages by expanding it. |


