Main article: 1888 United States presidential election
The 1888 United States presidential election in Virginia took place on November 6, 1888, as part of the 1888 United States presidential election . Voters chose 12 representatives, or electors to the Electoral College , who voted for president and vice president .
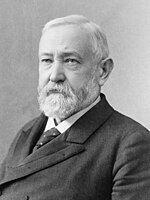
Virginia voted for the Democratic candidate, incumbent President Grover Cleveland over the Republican candidate, former U.S. Senator Benjamin Harrison . The contest in Virginia was very close and Cleveland narrowly won the state by a margin of just 0.53 percentage points. This was the closest the Republican Party came to winning an ex-Confederate state between the Compromise of 1877 and Warren G. Harding ’s 1920 win in Tennessee , and with Virginia voting 0.30 points more Republican than the nation at-large, would also prove the last time any former Confederate state voted more Republican than the nation until Virginia itself did so in 1952 .
This election represented the height of the expanded Reconstruction Era electorate. So complete was to be the disfranchisement of Virginia's lower classes with the new Constitution of 1902 that it was 1952, with a much larger population, before the electorate returned to the same numbers observed in 1888.
Results
Results by county
1888 United States presidential election in Virginia by counties and independent cities
Stephen Grover Cleveland
Benjamin Harrison
Clinton Bowen Fisk
Margin
Total votes cast
#
%
#
%
#
%
#
%
Accomack County
3,184
59.70%
1,993
37.37%
156
2.93%
1,191
22.33%
5,333
Albemarle County
2,573
54.15%
2,166
45.58%
13
0.27%
407
8.56%
4,752
Alexandria County
255
35.12%
462
63.64%
9
1.24%
-207
-28.51%
726
Alleghany County
759
43.13%
995
56.53%
6
0.34%
-236
-13.41%
1,760
Amelia County
704
40.46%
1,036
59.54%
0
0.00%
-332
-19.08%
1,740
Amherst County
1,777
55.74%
1,411
44.26%
0
0.00%
366
11.48%
3,188
Appomattox County
689
46.24%
787
52.82%
14
0.94%
-98
-6.58%
1,490
Augusta County
3,370
56.36%
2,526
42.25%
83
1.39%
844
14.12%
5,979
Bath County
482
54.22%
405
45.56%
2
0.22%
77
8.66%
889
Bedford County
3,204
61.64%
1,991
38.30%
3
0.06%
1,213
23.34%
5,198
Bland County
537
51.34%
509
48.66%
0
0.00%
28
2.68%
1,046
Botetourt County
1,558
55.62%
1,217
43.45%
26
0.93%
341
12.17%
2,801
Brunswick County
1,289
45.79%
1,521
54.03%
5
0.18%
-232
-8.24%
2,815
Buchanan County
492
53.54%
427
46.46%
0
0.00%
65
7.07%
919
Buckingham County
1,184
43.67%
1,520
56.07%
7
0.26%
-336
-12.39%
2,711
Campbell County
2,089
57.00%
1,564
42.67%
12
0.33%
525
14.32%
3,665
Caroline County
1,442
47.56%
1,588
52.37%
2
0.07%
-146
-4.82%
3,032
Carroll County
1,322
53.18%
1,147
46.14%
17
0.68%
175
7.04%
2,486
Charles City County
303
30.67%
684
69.23%
1
0.10%
-381
-38.56%
988
Charlotte County
1,720
62.39%
1,036
37.58%
1
0.04%
684
24.81%
2,757
Chesterfield County
1,589
50.05%
1,576
49.64%
10
0.31%
13
0.41%
3,175
Clarke County
1,204
69.20%
529
30.40%
7
0.40%
675
38.79%
1,740
Craig County
550
75.24%
177
24.21%
4
0.55%
373
51.03%
731
Culpeper County
1,404
54.31%
1,181
45.69%
0
0.00%
223
8.63%
2,585
Cumberland County
578
35.61%
1,045
64.39%
0
0.00%
-467
-28.77%
1,623
Dickenson County
451
53.95%
384
45.93%
1
0.12%
67
8.01%
836
Dinwiddie County
1,066
42.86%
1,411
56.74%
10
0.40%
-345
-13.87%
2,487
Elizabeth City County
547
29.10%
1,316
70.00%
17
0.90%
-769
-40.90%
1,880
Essex County
774
41.57%
1,088
58.43%
0
0.00%
-314
-16.86%
1,862
Fairfax County
2,010
52.21%
1,824
47.38%
16
0.42%
186
4.83%
3,850
Fauquier County
2,661
59.95%
1,778
40.05%
0
0.00%
883
19.89%
4,439
Floyd County
952
38.78%
1,482
60.37%
21
0.86%
-530
-21.59%
2,455
Fluvanna County
1,004
57.31%
739
42.18%
9
0.51%
265
15.13%
1,752
Franklin County
2,403
57.71%
1,757
42.20%
4
0.10%
646
15.51%
4,164
Frederick County
1,832
66.72%
871
31.72%
43
1.57%
961
35.00%
2,746
Giles County
977
59.36%
640
38.88%
29
1.76%
337
20.47%
1,646
Gloucester County
1,073
43.94%
1,368
56.02%
1
0.04%
-295
-12.08%
2,442
Goochland County
674
40.63%
985
59.37%
0
0.00%
-311
-18.75%
1,659
Grayson County
1,288
50.47%
1,259
49.33%
5
0.20%
29
1.14%
2,552
Greene County
532
50.57%
520
49.43%
0
0.00%
12
1.14%
1,052
Greensville County
714
44.35%
893
55.47%
3
0.19%
-179
-11.12%
1,610
Halifax County
3,570
58.74%
2,473
40.69%
35
0.58%
1,097
18.05%
6,078
Hanover County
1,721
53.22%
1,511
46.72%
2
0.06%
210
6.49%
3,234
Henrico County
1,712
42.40%
2,326
57.60%
0
0.00%
-614
-15.21%
4,038
Henry County
1,409
46.55%
1,608
53.12%
10
0.33%
-199
-6.57%
3,027
Highland County
454
50.33%
440
48.78%
8
0.89%
14
1.55%
902
Isle of Wight County
1,200
51.81%
1,116
48.19%
0
0.00%
84
3.63%
2,316
James City County
219
26.51%
607
73.49%
0
0.00%
-388
-46.97%
826
King and Queen County
958
53.61%
829
46.39%
0
0.00%
129
7.22%
1,787
King George County
542
42.95%
720
57.05%
0
0.00%
-178
-14.10%
1,262
King William County
746
40.57%
1,093
59.43%
0
0.00%
-347
-18.87%
1,839
Lancaster County
839
47.32%
928
52.34%
6
0.34%
-89
-5.02%
1,773
Lee County
1,479
52.86%
1,295
46.28%
24
0.86%
184
6.58%
2,798
Loudoun County
2,842
55.83%
2,190
43.03%
58
1.14%
652
12.81%
5,090
Louisa County
1,157
40.70%
1,677
58.99%
9
0.32%
-520
-18.29%
2,843
Lunenburg County
1,215
60.12%
806
39.88%
0
0.00%
409
20.24%
2,021
Madison County
961
51.45%
907
48.55%
0
0.00%
54
2.89%
1,868
Mathews County
1,023
61.92%
615
37.23%
14
0.85%
408
24.70%
1,652
Mecklenburg County
1,764
40.25%
2,607
59.48%
12
0.27%
-843
-19.23%
4,383
Middlesex County
635
40.81%
909
58.42%
12
0.77%
-274
-17.61%
1,556
Montgomery County
1,335
44.51%
1,516
50.55%
148
4.93%
-181
-6.04%
2,999
Nansemond County
1,382
39.84%
2,087
60.16%
0
0.00%
-705
-20.32%
3,469
Nelson County
1,554
55.94%
1,224
44.06%
0
0.00%
330
11.88%
2,778
New Kent County
375
34.92%
689
64.15%
10
0.93%
-314
-29.24%
1,074
Norfolk County
1,969
34.41%
3,741
65.37%
13
0.23%
-1,772
-30.96%
5,723
Northampton County
980
44.53%
1,221
55.47%
0
0.00%
-241
-10.95%
2,201
Northumberland County
851
48.41%
905
51.48%
2
0.11%
-54
-3.07%
1,758
Nottoway County
611
35.30%
1,116
64.47%
4
0.23%
-505
-29.17%
1,731
Orange County
1,126
49.21%
1,153
50.39%
9
0.39%
-27
-1.18%
2,288
Page County
1,195
47.05%
1,333
52.48%
12
0.47%
-138
-5.43%
2,540
Patrick County
1,239
54.46%
1,022
44.92%
14
0.62%
217
9.54%
2,275
Pittsylvania County
4,261
52.36%
3,847
47.27%
30
0.37%
414
5.09%
8,138
Powhatan County
561
42.21%
767
57.71%
1
0.08%
-206
-15.50%
1,329
Prince Edward County
1,130
42.63%
1,519
57.30%
2
0.08%
-389
-14.67%
2,651
Prince George County
661
39.37%
1,018
60.63%
0
0.00%
-357
-21.26%
1,679
Prince William County
1,313
63.83%
740
35.97%
4
0.19%
573
27.86%
2,057
Princess Anne County
844
45.52%
1,004
54.15%
6
0.32%
-160
-8.63%
1,854
Pulaski County
1,070
51.47%
993
47.76%
16
0.77%
77
3.70%
2,079
Rappahannock County
1,034
65.15%
553
34.85%
0
0.00%
481
30.31%
1,587
Richmond County
553
42.60%
741
57.09%
4
0.31%
-188
-14.48%
1,298
Roanoke County
935
42.58%
1,212
55.19%
49
2.23%
-277
-12.61%
2,196
Rockbridge County
2,030
49.22%
2,074
50.29%
20
0.48%
-44
-1.07%
4,124
Rockingham County
2,895
46.80%
3,175
51.33%
116
1.88%
-280
-4.53%
6,186
Russell County
1,601
54.23%
1,333
45.16%
18
0.61%
268
9.08%
2,952
Scott County
1,550
46.27%
1,800
53.73%
0
0.00%
-250
-7.46%
3,350
Shenandoah County
2,164
50.81%
2,063
48.44%
32
0.75%
101
2.37%
4,259
Smyth County
1,310
51.57%
1,228
48.35%
2
0.08%
82
3.23%
2,540
Southampton County
1,560
41.81%
2,117
56.74%
54
1.45%
-557
-14.93%
3,731
Spotsylvania County
876
48.67%
922
51.22%
2
0.11%
-46
-2.56%
1,800
Stafford County
595
40.26%
883
59.74%
0
0.00%
-288
-19.49%
1,478
Surry County
661
37.39%
1,101
62.27%
6
0.34%
-440
-24.89%
1,768
Sussex County
896
36.07%
1,582
63.69%
6
0.24%
-686
-27.62%
2,484
Tazewell County
1,307
36.31%
2,245
62.36%
48
1.33%
-938
-26.06%
3,600
Warren County
1,224
72.43%
440
26.04%
26
1.54%
784
46.39%
1,690
Warwick County
385
33.54%
763
66.46%
0
0.00%
-378
-32.93%
1,148
Washington County
2,920
52.82%
2,548
46.09%
60
1.09%
372
6.73%
5,528
Westmoreland County
626
38.24%
1,009
61.64%
2
0.12%
-383
-23.40%
1,637
Wise County
722
49.15%
742
50.51%
5
0.34%
-20
-1.36%
1,469
Wythe County
1,462
46.84%
1,643
52.64%
16
0.51%
-181
-5.80%
3,121
York County
495
33.13%
972
65.06%
27
1.81%
-477
-31.93%
1,494
Alexandria City
1,665
51.95%
1,523
47.52%
17
0.53%
142
4.43%
3,205
Charlottesville City
674
61.89%
407
37.37%
8
0.73%
267
24.52%
1,089
Danville City
1,070
56.76%
812
43.08%
3
0.16%
258
13.69%
1,885
Fredericksburg City
595
59.26%
409
40.74%
0
0.00%
186
18.53%
1,004
Lynchburg City
2,054
53.20%
1,796
46.52%
11
0.28%
258
6.68%
3,861
Manchester City
896
54.63%
735
44.82%
9
0.55%
161
9.82%
1,640
Newport News City
2,613
44.77%
3,198
54.80%
25
0.43%
-585
-10.02%
5,836
Norfolk City
337
60.07%
223
39.75%
1
0.18%
114
20.32%
561
Petersburg City
2,067
48.46%
2,198
51.54%
0
0.00%
-131
-3.07%
4,265
Portsmouth City
1,439
55.99%
1,107
43.07%
24
0.93%
332
12.92%
2,570
Richmond City
8,211
56.69%
6,273
43.31%
0
0.00%
1,938
13.38%
14,484
Radford City
1,155
53.97%
976
45.61%
9
0.42%
179
8.36%
2,140
Roanoke City
719
54.43%
535
40.50%
67
5.07%
184
13.93%
1,321
Staunton City
101
37.83%
161
60.30%
5
1.87%
-60
-22.47%
267
Winchester City
488
46.83%
540
51.82%
14
1.34%
-52
-4.99%
1,042
Totals
152,004
49.99%
150,399
49.46%
1,684
0.55%
1,605
0.53%
304,087
Notes
the Nineteenth Amendment had enfranchised women in 1920, so that the equivalent size is twice the total vote cast in 1888.
References
Key, Valdimer Orlando ; Southern Politics in State and Nation , p. 15 Alfred A. Knopf (1949)
Presidential General Election Results Comparison — Virginia
"1888 Presidential General Election Results — Virginia" . U.S. Election Atlas. Retrieved April 12, 2013."Presidential election of 1888 Popular Vote" . Géoelections."Popular Vote for Clinton Fisk" . Géoelections.
Categories :
Text is available under the Creative Commons Attribution-ShareAlike License. Additional terms may apply.
**DISCLAIMER** We are not affiliated with Wikipedia, and Cloudflare.
The information presented on this site is for general informational purposes only and does not constitute medical advice.
You should always have a personal consultation with a healthcare professional before making changes to your diet, medication, or exercise routine.
AI helps with the correspondence in our chat.
We participate in an affiliate program. If you buy something through a link, we may earn a commission 💕
↑
 County Results


