Main article: 1976 United States presidential election
The 1976 United States presidential election in Montana was part of the 1976 United States presidential election , which took place on November 2, 1976. Voters chose four representatives, or electors to the Electoral College , who voted for president and vice president .
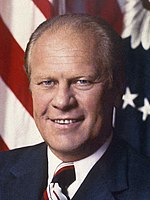
Montana voted for the Republican nominee, President Gerald Ford , over the Democratic nominee, former Georgia Governor Jimmy Carter . Ford won Montana by a margin of 7.44%. As of the 2020 presidential election , this is the last election in which McCone County and Wibaux County voted for a Democratic presidential candidate. Carter became the first ever Democrat to win the White House without carrying Daniels , Judith Basin , Pondera , Teton , or Toole Counties, as well as the first to do so without carrying Cascade County since Grover Cleveland in 1892 , and the first to do so without carrying Chouteau or Valley Counties since Woodrow Wilson in 1912 .
Results
Results by county
County
Gerald Ford
Jimmy Carter
Thomas Anderson
Margin
Total votes cast
#
%
#
%
#
%
#
%
Beaverhead
2,461
69.46%
1,013
28.59%
69
1.95%
1,448
40.87%
3,543
Big Horn
1,615
44.49%
1,962
54.05%
53
1.46%
-347
-9.56%
3,630
Blaine
1,349
49.25%
1,356
49.51%
34
1.24%
-7
-0.26%
2,739
Broadwater
820
59.04%
557
40.10%
12
0.86%
263
18.94%
1,389
Carbon
2,121
52.44%
1,853
45.81%
71
1.76%
268
6.63%
4,045
Carter
558
57.41%
344
35.39%
70
7.20%
214
22.02%
972
Cascade
15,289
50.11%
14,678
48.11%
544
1.78%
611
2.00%
30,511
Chouteau
1,814
52.35%
1,568
45.25%
83
2.40%
246
7.10%
3,465
Custer
3,120
55.25%
2,425
42.94%
102
1.81%
695
12.31%
5,647
Daniels
816
49.79%
797
48.63%
26
1.59%
19
1.16%
1,639
Dawson
2,639
53.21%
2,201
44.38%
120
2.42%
438
8.83%
4,960
Deer Lodge
2,197
35.57%
3,859
62.48%
120
1.94%
-1,662
-26.91%
6,176
Fallon
934
51.98%
847
47.13%
16
0.89%
87
4.85%
1,797
Fergus
3,556
57.73%
2,470
40.10%
134
2.18%
1,086
17.63%
6,160
Flathead
10,494
55.69%
7,827
41.53%
524
2.78%
2,667
14.16%
18,845
Gallatin
11,062
63.36%
6,215
35.60%
183
1.05%
4,847
27.76%
17,460
Garfield
625
67.79%
273
29.61%
24
2.60%
352
38.18%
922
Glacier
1,892
50.81%
1,755
47.13%
77
2.07%
137
3.68%
3,724
Golden Valley
302
53.08%
255
44.82%
12
2.11%
47
8.26%
569
Granite
746
58.65%
509
40.02%
17
1.34%
237
18.63%
1,272
Hill
3,274
45.10%
3,878
53.42%
108
1.49%
-604
-8.32%
7,260
Jefferson
1,387
52.26%
1,210
45.59%
57
2.15%
177
6.67%
2,654
Judith Basin
809
50.12%
772
47.83%
33
2.04%
37
2.29%
1,614
Lake
3,809
52.83%
3,253
45.12%
148
2.05%
556
7.71%
7,210
Lewis and Clark
10,155
54.84%
8,118
43.84%
244
1.32%
2,037
11.00%
18,517
Liberty
638
54.86%
506
43.51%
19
1.63%
132
11.35%
1,163
Lincoln
3,017
48.02%
3,146
50.07%
120
1.91%
-129
-2.05%
6,283
McCone
730
48.70%
749
49.97%
20
1.33%
-19
-1.27%
1,499
Madison
1,688
64.67%
870
33.33%
52
1.99%
818
31.34%
2,610
Meagher
565
60.17%
364
38.76%
10
1.06%
201
21.41%
939
Mineral
679
44.85%
819
54.10%
16
1.06%
-140
-9.25%
1,514
Missoula
16,350
51.36%
15,099
47.43%
388
1.22%
1,251
3.93%
31,837
Musselshell
1,117
54.09%
922
44.65%
26
1.26%
195
9.44%
2,065
Park
3,281
57.16%
2,364
41.18%
95
1.66%
917
15.98%
5,740
Petroleum
211
63.75%
110
33.23%
10
3.02%
101
30.52%
331
Phillips
1,347
54.18%
1,117
44.93%
22
0.88%
230
9.25%
2,486
Pondera
1,666
52.89%
1,413
44.86%
71
2.25%
253
8.03%
3,150
Powder River
683
55.30%
429
34.74%
123
9.96%
254
20.56%
1,235
Powell
1,610
54.56%
1,302
44.12%
39
1.32%
308
10.44%
2,951
Prairie
597
58.59%
415
40.73%
7
0.69%
182
17.86%
1,019
Ravalli
4,894
56.29%
3,504
40.30%
296
3.40%
1,390
15.99%
8,694
Richland
2,189
51.35%
1,961
46.00%
113
2.65%
228
5.35%
4,263
Roosevelt
1,822
46.38%
2,061
52.47%
45
1.15%
-239
-6.09%
3,928
Rosebud
1,538
51.16%
1,413
47.01%
55
1.83%
125
4.15%
3,006
Sanders
1,738
48.60%
1,725
48.24%
113
3.16%
13
0.36%
3,576
Sheridan
1,114
41.05%
1,560
57.48%
40
1.47%
-446
-16.43%
2,714
Silver Bow
7,506
39.28%
11,377
59.53%
227
1.19%
-3,871
-20.25%
19,110
Stillwater
1,446
54.88%
1,143
43.38%
46
1.75%
303
11.50%
2,635
Sweet Grass
1,135
68.41%
502
30.26%
22
1.33%
633
38.15%
1,659
Teton
1,730
51.72%
1,506
45.02%
109
3.26%
224
6.70%
3,345
Toole
1,469
56.43%
1,080
41.49%
54
2.07%
389
14.94%
2,603
Treasure
315
55.85%
239
42.38%
10
1.77%
76
13.47%
564
Valley
2,520
50.82%
2,352
47.43%
87
1.75%
168
3.39%
4,959
Wheatland
755
57.20%
535
40.53%
30
2.27%
220
16.67%
1,320
Wibaux
308
44.57%
352
50.94%
31
4.49%
-44
-6.37%
691
Yellowstone
25,201
57.11%
18,329
41.54%
595
1.35%
6,872
15.57%
44,125
Totals
173,703
52.84%
149,259
45.40%
5,772
1.76%
24,444
7.44%
328,734
Counties that flipped from Republican to Democratic
See also
References
‘How the Red and Blue Map Evolved Over the Past Century’ ; America Magazine in The National Catholic Review ; June 29, 2016
David Leip. "1976 Presidential General Election Results – Montana" . Dave Leip’s U.S. Election Atlas.
Categories :
Text is available under the Creative Commons Attribution-ShareAlike License. Additional terms may apply.
**DISCLAIMER** We are not affiliated with Wikipedia, and Cloudflare.
The information presented on this site is for general informational purposes only and does not constitute medical advice.
You should always have a personal consultation with a healthcare professional before making changes to your diet, medication, or exercise routine.
AI helps with the correspondence in our chat.
We participate in an affiliate program. If you buy something through a link, we may earn a commission 💕
↑
 County Results


