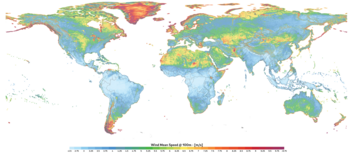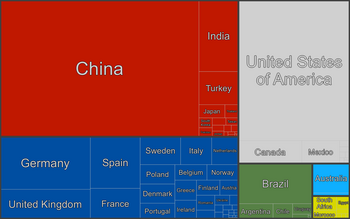

The worldwide total cumulative installed electricity generation capacity from wind power has increased rapidly since the start of the third millennium, and as of the end of 2022, it amounts to almost 900 GW. Since 2010, more than half of all new wind power was added outside the traditional markets of Europe and North America, mainly driven by the continuing boom in China and India. China alone had over 40% of the world's capacity by 2022.
Wind power is used on a commercial basis in more than half of all the countries of the world. Denmark produced 55% of its electricity from wind in 2022, a larger share than any other country. Latvia's wind capacity grew by 75%, the largest percent increase in 2022.
In November 2018, wind power generation in Scotland was higher than the country's electricity consumption during the month. Wind power's share of worldwide electricity usage in 2022 was 7.3%, up from 8.9% from the prior year. In Europe, wind was 11.2% of generation in 2022. In 2018, upcoming wind power markets rose from 8% to 10% across the Middle East, Latin America, South East Asia, and Africa.
Generation by country


Number of countries with wind
capacities in the gigawatt-scale
| Graphs are unavailable due to technical issues. Updates on reimplementing the Graph extension, which will be known as the Chart extension, can be found on Phabricator and on MediaWiki.org. |
The following table lists these data for each country:
- total generation from wind in terawatt-hours,
- percent of that country's generation that was wind,
- total wind capacity in gigawatts,
- percent growth in wind capacity, and
- the wind capacity factor for that year.
Data are sourced from Ember and refer to the year 2023 unless otherwise specified. The table only includes countries with more than 0.1 TWh of generation.
| Country | Gen (TWh) |
% gen. |
Cap. (GW) |
% cap. growth |
Cap. fac. |
|---|---|---|---|---|---|
| World | 2310.61 | 7.8 | 1017.20 | 12.9 | 26% |
| 885.87 | 9.4 | 441.89 | 20.7 | 23% | |
| 425.23 | 10.0 | 148.02 | 4.5 | 33% | |
| 137.32 | 27.1 | 69.46 | 5.0 | 23% | |
| 95.51 | 13.5 | 29.14 | 20.6 | 37% | |
| 82.31 | 28.8 | 30.22 | 5.1 | 31% | |
| 82.11 | 4.2 | 44.74 | 6.7 | 21% | |
| 64.13 | 23.8 | 31.03 | 3.1 | 24% | |
| 48.61 | 9.5 | 22.20 | 6.7 | 25% | |
| 38.94 | 6.2 | 16.99 | 11.3 | 26% | |
| 34.72 | 20.9 | 16.25 | 13.8 | 24% | |
| 33.88 | 10.6 | 11.70 | 2.6 | 33% | |
| 31.87 | 11.7 | 11.33 | 7.3 | 32% | |
| 29.27 | 24.3 | 10.75 | 22.9 | 31% | |
| 23.51 | 9.0 | 12.31 | 4.1 | 22% | |
| 23.06 | 13.7 | 9.31 | 14.2 | 28% | |
| 21.65 | 6.1 | 7.32 | 0.0 | 34% | |
| 19.41 | 57.7 | 7.48 | 5.6 | 30% | |
| 15.27 | 18.5 | 5.50 | 3.8 | 32% | |
| 14.96 | 9.7 | 5.06 | 0.0 | 34% | |
| 14.63 | 18.3 | 6.96 | 22.5 | 24% | |
| 14.48 | 9.9 | 3.71 | 12.1 | 45% | |
| 13.23 | 29.5 | 5.62 | 1.4 | 27% | |
| 11.64 | 37.1 | 4.81 | 5.9 | 28% | |
| 11.58 | 5.0 | 3.44 | 8.9 | 38% | |
| 11.37 | 4.1 | 5.89 | 16.2 | 22% | |
| 10.91 | 22.1 | 5.22 | 11.1 | 24% | |
| 10.01 | 1.0 | 5.23 | 19.7 | 22% | |
| 9.88 | 11.8 | 4.51 | 17.8 | 25% | |
| 8.05 | 12.0 | 3.98 | 11.2 | 23% | |
| 7.52 | 13.4 | 3.09 | 2.3 | 28% | |
| 6.57 | 15.3 | 1.86 | 19.2 | 40% | |
| 6.20 | 2.2 | 2.67 | 69.0 | 27% | |
| 5.74 | 2.6 | 1.89 | 15.2 | 35% | |
| 4.75 | 0.4 | 2.52 | 13.5 | 22% | |
| 4.74 | 35.9 | 1.52 | 0.0 | 36% | |
| 3.65 | 3.2 | 1.44 | 29.7 | 29% | |
| 3.61 | 1.9 | 1.55 | 0.0 | 27% | |
| 3.47 | 7.8 | 1.06 | 7.1 | 37% | |
| 3.39 | 0.6 | 2.17 | 13.6 | 18% | |
| 2.90 | 1.8 | 1.85 | 0.0 | 18% | |
| 2.53 | 45.5 | 1.29 | 35.8 | 22% | |
| 2.52 | 14.9 | 1.14 | 15.2 | 25% | |
| 2.23 | 3.7 | 0.71 | 31.5 | 36% | |
| 2.00 | 16.4 | 0.44 | 0.0 | 52% | |
| 1.61 | 7.4 | 0.61 | -3.2 | 30% | |
| 1.55 | 3.9 | 0.70 | 0.0 | 25% | |
| 1.55 | 1.4 | 1.76 | 0.0 | 10% | |
| 1.51 | 1.3 | 0.44 | 0.0 | 39% | |
| 1.47 | 12.3 | 0.41 | 5.1 | 41% | |
| 1.45 | 0.3 | 0.40 | 0.0 | 41% | |
| 1.33 | 0.4 | 0.36 | 5.9 | 42% | |
| 1.32 | 6.1 | 0.42 | 13.5 | 36% | |
| 0.94 | 2.5 | 0.51 | 27.5 | 21% | |
| 0.77 | 6.4 | 0.24 | 0.0 | 37% | |
| 0.75 | 11.6 | 0.41 | 28.1 | 21% | |
| 0.74 | 9.5 | 0.16 | 0.0 | 53% | |
| 0.72 | 1.0 | 0.34 | 0.0 | 24% | |
| 0.66 | 15.4 | 0.19 | 0.0 | 40% | |
| 0.63 | 1.8 | 0.32 | 0.0 | 22% | |
| 0.62 | 7.7 | 0.16 | 0.0 | 44% | |
| 0.59 | 3.8 | 0.40 | 25.0 | 17% | |
| 0.53 | 4.0 | 0.34 | 25.9 | 18% | |
| 0.49 | 43.0 | 0.22 | 29.4 | 25% | |
| 0.48 | 0.1 | 0.15 | 0.0 | 37% | |
| 0.47 | 3.9 | 0.14 | 7.7 | 38% | |
| 0.43 | 2.5 | 0.25 | 0.0 | 20% | |
| 0.34 | 2.6 | 0.11 | 0.0 | 35% | |
| 0.34 | 1.6 | 0.25 | 0.0 | 16% | |
| 0.33 | 8.1 | 0.12 | 0.0 | 31% | |
| 0.28 | 6.1 | 0.10 | 0.0 | 32% | |
| 0.26 | 1.5 | 0.14 | 0.0 | 21% | |
| 0.26 | 4.2 | 0.14 | 75.0 | 21% | |
| 0.21 | 0.2 | 0.02 | 0.0 | - | |
| 0.21 | 3.9 | 0.16 | 0.0 | 15% | |
| 0.20 | 0.6 | 0.07 | 250.0 | 33% | |
| 0.19 | 0.5 | 0.12 | 9.1 | 18% | |
| 0.18 | 0.2 | 0.14 | 366.7 | 15% | |
| 0.17 | 2.7 | 0.14 | 100.0 | 14% | |
| 0.17 | 2.9 | 0.14 | 16.7 | 14% | |
| 0.17 | 0.2 | 0.09 | 0.0 | 22% | |
| 0.16 | 9.4 | 0.03 | 0.0 | 61% | |
| 0.16 | 0.8 | 0.10 | 0.0 | 18% | |
| 0.14 | 2.0 | 0.11 | 57.1 | 15% | |
| 0.14 | 14.3 | 0.03 | 0.0 | 53% |
See also
References
- "Share of electricity production from wind". Our World in Data. Retrieved 20 June 2024.
- "Global Wind Atlas". Technical University of Denmark (DTU). Archived from the original on 18 January 2019. Retrieved 23 November 2021.
- ^ "Yearly electricity data". ember-climate.org. 6 December 2023. Retrieved 20 August 2024.
- "Countries - Online Access - The wind power - Wind energy market intelligence". The Wind Power. Retrieved 13 January 2020.
- "'Historic' month as wind power meets 109% of energy demands". STV. Retrieved 18 December 2018.
- "The wind energy capacity in 2018". 21 June 2019.
| Wind power by country | |||||||||||||||
|---|---|---|---|---|---|---|---|---|---|---|---|---|---|---|---|
| |||||||||||||||
| Lists of countries by energy rankings | |||||||
|---|---|---|---|---|---|---|---|
| Fossil Fuel |
| ||||||
| Nuclear |
| ||||||
| Renewable | |||||||
| Electricity | |||||||
| Total energy | |||||||