Main article: 1964 United States presidential election
| ||||||||||||||||||||||||||
| ||||||||||||||||||||||||||
 County Results County Results
| ||||||||||||||||||||||||||
| ||||||||||||||||||||||||||
The 1964 United States presidential election in Nevada took place on November 3, 1964, as part of the 1964 United States presidential election. State voters chose three representatives, or electors, to the Electoral College, who voted for president and vice president.
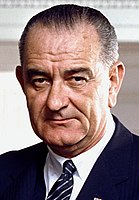
Nevada was won by incumbent President Lyndon B. Johnson (D–Texas), with 58.58% of the popular vote, against Senator Barry Goldwater (R–Arizona), with 41.42% of the popular vote.
As of the 2024 presidential election, this is the last election in which Elko County, Humboldt County, Pershing County, Lander County, Lincoln County, and Eureka County voted for a Democratic presidential candidate. Washoe County and Carson City did not vote Democratic again until 2008. This was also the last election until 1992 that a Democratic presidential candidate carried Nevada, and the last until 2008 in which the party received a majority of the vote.
Results
| Party | Candidate | Votes | % | |
|---|---|---|---|---|
| Democratic | Lyndon B. Johnson (inc.) | 79,339 | 58.58% | |
| Republican | Barry Goldwater | 56,094 | 41.42% | |
| Total votes | 135,433 | 100% | ||
Results by county
| County | Lyndon B. Johnson Democratic |
Barry Goldwater Republican |
Margin | Total votes cast | |||
|---|---|---|---|---|---|---|---|
| # | % | # | % | # | % | ||
| Churchill | 1,565 | 49.34% | 1,607 | 50.66% | -42 | -1.32% | 3,172 |
| Clark | 40,760 | 63.02% | 23,921 | 36.98% | 16,839 | 26.04% | 64,681 |
| Douglas | 1,010 | 47.26% | 1,127 | 52.74% | -117 | -5.48% | 2,137 |
| Elko | 2,785 | 60.01% | 1,856 | 39.99% | 929 | 20.02% | 4,641 |
| Esmeralda | 187 | 58.81% | 131 | 41.19% | 56 | 17.62% | 318 |
| Eureka | 285 | 53.98% | 243 | 46.02% | 42 | 7.96% | 528 |
| Humboldt | 1,421 | 56.23% | 1,106 | 43.77% | 315 | 12.46% | 2,527 |
| Lander | 391 | 53.64% | 338 | 46.36% | 53 | 7.28% | 729 |
| Lincoln | 785 | 64.08% | 440 | 35.92% | 345 | 28.16% | 1,225 |
| Lyon | 1,327 | 48.72% | 1,397 | 51.28% | -70 | -2.56% | 2,724 |
| Mineral | 1,440 | 60.84% | 927 | 39.16% | 513 | 21.68% | 2,367 |
| Nye | 1,276 | 60.82% | 822 | 39.18% | 454 | 21.64% | 2,098 |
| Ormsby | 2,129 | 51.60% | 1,997 | 48.40% | 132 | 3.20% | 4,126 |
| Pershing | 738 | 60.29% | 486 | 39.71% | 252 | 20.58% | 1,224 |
| Storey | 261 | 60.28% | 172 | 39.72% | 89 | 20.56% | 433 |
| Washoe | 20,170 | 52.36% | 18,350 | 47.64% | 1,820 | 4.72% | 38,520 |
| White Pine | 2,809 | 70.52% | 1,174 | 29.48% | 1,635 | 41.04% | 3,983 |
| Totals | 79,339 | 58.58% | 56,094 | 41.42% | 23,245 | 17.16% | 135,433 |
Counties that flipped from Republican to Democratic
See also
References
- "United States Presidential election of 1964 - Encyclopædia Britannica". Retrieved May 29, 2017.
- "1964 Election for the Forty-Fifth Term (1965-69)". Retrieved May 29, 2017.
- "1964 Presidential General Election Results - Nevada". Retrieved May 29, 2017.
- "The American Presidency Project - Election of 1964". Retrieved May 29, 2017.
- Sullivan, Robert David; ‘How the Red and Blue Map Evolved Over the Past Century’; America Magazine in The National Catholic Review; June 29, 2016
- ^ Official Returns of the General Election of 1964. Carson City, Nevada: State Printing Office. p. 6. Retrieved July 9, 2024.
| State and district results of the 1964 United States presidential election | ||
|---|---|---|
|  | |
| (1963 ←) 1964 United States elections (→ 1965) | |
|---|---|
| President | |
| U.S. Senate |
|
| U.S. House |
|
| State governors | |
| State legislature | |
This Nevada elections-related article is a stub. You can help Misplaced Pages by expanding it. |


