Main article: 2000 United States presidential election
| ||||||||||||||||||||||||||
| Turnout | 70% | |||||||||||||||||||||||||
|---|---|---|---|---|---|---|---|---|---|---|---|---|---|---|---|---|---|---|---|---|---|---|---|---|---|---|
| ||||||||||||||||||||||||||
 County Results County Results
| ||||||||||||||||||||||||||
| ||||||||||||||||||||||||||
The 2000 United States presidential election in Nevada took place on November 7, 2000, and was part of the 2000 United States presidential election. Voters chose four representatives, or electors to the Electoral College, who voted for president and vice president.
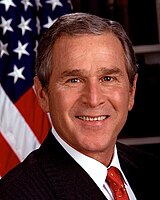
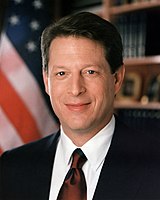
Nevada was won by Texas Governor George W. Bush, who won the state with 49.52% of the vote over Al Gore, who took 45.98%. Bush won every county except Clark County, which is home of Las Vegas. Bush also won Nevada's 2nd congressional district, as Gore won Nevada's 1st congressional district. Also, Ralph Nader got over 2% of the vote. This was also the most recent presidential election (while also being the only time since 1976, and the second time since 1908), when Nevada did not side with the winner of the popular vote. Nevada was one of many states decided by close margins; had Gore won the Silver State's 4 electoral votes, the election would have gone his way.
Nevada weighed in as 2% more Republican than the national average; in the previous election, it was 4% more Republican. The state was returned to the Republican column regardless. This is the first time New Mexico and Nevada have ever voted for different candidates since New Mexico's first election in 1912. Nevada was one of nine states that had supported Clinton twice that Gore (who was the sitting vice president at the time of the election) lost to Bush.
As of 2024, this is the last time that Nevada did not back the winner of the national popular vote.
Results
| 2000 United States presidential election in Nevada | |||||
|---|---|---|---|---|---|
| Party | Candidate | Votes | Percentage | Electoral votes | |
| Republican | George W. Bush | 301,575 | 49.52% | 4 | |
| Democratic | Al Gore | 279,978 | 45.98% | 0 | |
| Green | Ralph Nader | 15,008 | 2.46% | 0 | |
| Reform | Patrick Buchanan | 4,747 | 0.78% | 0 | |
| N/A | None of these candidates | 3,315 | 0.54% | 0 | |
| Libertarian | Harry Browne | 3,311 | 0.54% | 0 | |
| Ind. American | Howard Phillips | 621 | 0.10% | 0 | |
| Natural Law | John Hagelin | 415 | 0.07% | 0 | |
| Totals | 608,970 | 100.00% | 4 | ||
| Voter turnout (Voting age/registered) | 41%/70% | ||||
By county
| County | George W. Bush Republican |
Al Gore Democratic |
Various candidates Other parties |
Margin | Total | ||||
|---|---|---|---|---|---|---|---|---|---|
| # | % | # | % | # | % | # | % | ||
| Carson City | 11,084 | 56.98% | 7,354 | 37.81% | 1,014 | 5.21% | 3,730 | 19.17% | 19,452 |
| Churchill | 6,237 | 70.69% | 2,191 | 24.83% | 395 | 4.48% | 4,046 | 45.86% | 8,823 |
| Clark | 170,932 | 44.72% | 196,100 | 51.31% | 15,166 | 3.97% | -25,168 | -6.59% | 382,198 |
| Douglas | 11,193 | 62.27% | 5,837 | 32.47% | 944 | 5.25% | 5,356 | 29.80% | 17,974 |
| Elko | 11,025 | 77.75% | 2,542 | 17.93% | 613 | 4.32% | 8,483 | 59.82% | 14,180 |
| Esmeralda | 333 | 67.82% | 116 | 23.63% | 42 | 8.55% | 217 | 44.19% | 491 |
| Eureka | 632 | 75.51% | 150 | 17.92% | 55 | 6.57% | 482 | 57.59% | 837 |
| Humboldt | 3,638 | 72.33% | 1,128 | 22.43% | 264 | 5.25% | 2,510 | 49.90% | 5,030 |
| Lander | 1,619 | 76.40% | 395 | 18.64% | 105 | 4.96% | 1,224 | 57.76% | 2,119 |
| Lincoln | 1,372 | 70.14% | 461 | 23.57% | 123 | 6.29% | 911 | 46.57% | 1,956 |
| Lyon | 7,270 | 60.62% | 3,955 | 32.98% | 767 | 6.40% | 3,315 | 27.64% | 11,992 |
| Mineral | 1,227 | 53.51% | 916 | 39.95% | 150 | 6.54% | 311 | 13.56% | 2,293 |
| Nye | 6,904 | 56.68% | 4,525 | 37.15% | 752 | 6.17% | 2,379 | 19.53% | 12,181 |
| Pershing | 1,221 | 67.76% | 476 | 26.42% | 105 | 5.83% | 745 | 41.34% | 1,802 |
| Storey | 1,014 | 56.40% | 666 | 37.04% | 118 | 6.56% | 348 | 19.36% | 1,798 |
| Washoe | 63,640 | 52.04% | 52,097 | 42.60% | 6,564 | 5.37% | 11,543 | 9.44% | 122,301 |
| White Pine | 2,234 | 63.05% | 1,069 | 30.17% | 240 | 6.77% | 1,165 | 32.88% | 3,543 |
| Totals | 301,575 | 49.52% | 279,978 | 45.98% | 27,417 | 4.50% | 21,597 | 3.54% | 608,970 |
Counties that flipped from Democratic to Republican
By congressional district
Bush and Gore both won a congressional district.
| District | Bush | Gore | Representative |
|---|---|---|---|
| 1st | 42% | 54% | Shelley Berkley |
| 2nd | 54% | 41% | Jim Gibbons |
Electors
Main article: List of 2000 United States presidential electorsTechnically the voters of Nevada cast their ballots for electors: representatives to the Electoral College. Nevada is allocated 4 electors because it has two congressional districts and two senators. All candidates who appear on the ballot or qualify to receive write-in votes must submit a list of four electors, who pledge to vote for their candidate and his or her running mate. Whoever wins the majority of votes in the state is awarded all four electoral votes. Their chosen electors then vote for president and vice president. Although electors are pledged to their candidate and running mate, they are not obligated to vote for them. An elector who votes for someone other than his or her candidate is known as a faithless elector.
The electors of each state and the District of Columbia met on December 18, 2000 to cast their votes for president and vice president. The Electoral College itself never meets as one body. Instead the electors from each state and the District of Columbia met in their respective capitols.
The following were the members of the Electoral College from the state. All were pledged to and voted for George W. Bush and Dick Cheney:
- Jane Ham
- Trudy Hushbeck
- William Raggio
- Tom Wiesner
See also
References
- "Dave Leip's Atlas of U.S. Presidential Elections".
- 2000 Presidential General Election Results - Nevada US Election Atlas
- "2000 Post-Election Timeline of Events".
- "President Elect - 2000". Archived from the original on February 12, 2012. Retrieved October 31, 2009.
| State and district results of the 2000 United States presidential election | ||
|---|---|---|
|  | |


