Main article: 1948 United States presidential election
| |||||||||||||||||||||||||||||
| |||||||||||||||||||||||||||||
 County Results County Results Congressional District Results Congressional District Results
| |||||||||||||||||||||||||||||
| |||||||||||||||||||||||||||||
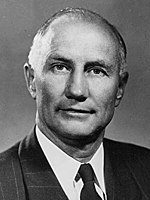
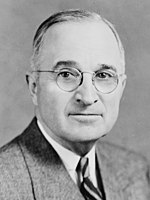
The 1948 United States presidential election in South Carolina took place on November 2, 1948, as part of the 1948 United States presidential election. State voters chose eight electors to the Electoral College, which selected the president and vice president. South Carolina was won by States' Rights Democratic candidate Strom Thurmond, defeating the Democratic candidate, incumbent President Harry S. Truman, and New York Governor Thomas E. Dewey.
For six decades South Carolina had been a one-party state dominated by the Democratic Party. The Republican Party had been moribund due to the disfranchisement of blacks and the complete absence of other support bases as South Carolina completely lacked upland or German refugee whites opposed to secession. Between 1900 and 1944, no Republican presidential candidate ever obtained more than seven percent of the total presidential vote – a vote which in 1924 reached as low as 6.6 percent of the total voting-age population (or approximately 15 percent of the voting-age white population).
This absolute loyalty to the Democratic Party – so strong that even Catholic Al Smith in 1928 received over ninety percent of South Carolina's limited vote total at the same time as five former Confederate states voted for Herbert Hoover – began to break down with Henry A. Wallace's appointment as Vice President and the 1943 Detroit race riots. The northern left wing of the Democratic Party became as a result of this riot committed to restoring black political rights, a policy vehemently opposed by most Southern Democrats as an infringement upon "states' rights". Tension widened much further when new President Harry Truman, himself a Southerner from Missouri, had described to him a number of horrifying lynchings and racial violence against black veterans, most crucially the beating and blinding of Isaac Woodard three hours after being discharged from the army. Truman, previously viewed as no friend of civil rights, came to believe that racial violence against blacks in the South was a threat to the United States' image abroad and its ability to win the Cold War against the radically egalitarian rhetoric of Communism.
The result was a major civil rights plan titled To Secure These Rights a year later, and a civil rights plank in the 1948 Democratic platform. Southern Democrats were enraged by these proposals and thus sought to form a "States' Rights" Democratic ticket, which would replace Truman as the official Democratic nominee. In South Carolina, Dixiecrats completely controlled the situation and achieved this as early as the state's May presidential primary. Consequently, Thurmond and Mississippi Governor Fielding Wright were listed as the official "Democratic" nominees. 76% of white voters supported Thurmond.
Polls
| Source | Ranking | As of |
|---|---|---|
| The Herald-Sun | Safe I (flip) | September 12, 1948 |
| Chattanooga Daily Times | Safe I (flip) | October 15, 1948 |
| The Evening Star | Certain I (flip) | October 20, 1948 |
| The Montgomery Advertiser | Certain I (flip) | October 24, 1948 |
| Mount Vernon Argus | Certain I (flip) | November 1, 1948 |
| Oakland Tribune | Safe I (flip) | November 1, 1948 |
Results
| 1948 United States presidential election in South Carolina | ||||||||
|---|---|---|---|---|---|---|---|---|
| Party | Candidate | Running mate | Popular vote | Electoral vote | ||||
| Count | % | Count | % | |||||
| Dixiecrat | Strom Thurmond of South Carolina | Fielding Lewis Wright of Mississippi | 102,607 | 71.97% | 8 | 100.00% | ||
| Democratic | Harry S. Truman of Missouri (incumbent) | Alben William Barkley of Kentucky | 34,423 | 24.14% | 0 | 0.00% | ||
| Republican | Thomas Edmund Dewey of New York | Earl Warren of California | 5,386 | 3.78% | 0 | 0.00% | ||
| Progressive | Henry Agard Wallace of Iowa | Glen Hearst Taylor of Idaho | 154 | 0.11% | 0 | 0.00% | ||
| Write-in | Norman Thomas of New York | Tucker Powell Smith of Michigan | 1 | 0.00% | 0 | 0.00% | ||
| Total | 142,571 | 100.00% | 8 | 100.00% | ||||
Results by county
| County | James Strom Thurmond States’ Rights/Democratic |
Thomas Edmund Dewey Republican |
Harry S. Truman Democratic |
Henry Agard Wallace Progressive |
Margin | Total votes cast | |||||
|---|---|---|---|---|---|---|---|---|---|---|---|
| # | % | # | % | # | % | # | % | # | % | ||
| Abbeville | 787 | 73.97% | 23 | 2.16% | 254 | 23.87% | 0 | 0.00% | 533 | 50.09% | 1,064 |
| Aiken | 4,607 | 86.94% | 115 | 2.17% | 572 | 10.79% | 5 | 0.09% | 4,035 | 76.15% | 5,299 |
| Allendale | 1,041 | 93.78% | 14 | 1.26% | 55 | 4.95% | 0 | 0.00% | 986 | 88.83% | 1,110 |
| Anderson | 1,342 | 33.32% | 105 | 2.61% | 2,581 | 64.08% | 0 | 0.00% | -1,239 | -30.76% | 4,028 |
| Bamberg | 1,714 | 91.51% | 34 | 1.82% | 124 | 6.62% | 1 | 0.05% | 1,590 | 84.89% | 1,873 |
| Barnwell | 1,920 | 93.02% | 28 | 1.36% | 115 | 5.57% | 1 | 0.05% | 1,805 | 87.45% | 2,064 |
| Beaufort | 850 | 67.62% | 150 | 11.93% | 253 | 20.13% | 4 | 0.32% | 597 | 47.49% | 1,257 |
| Berkeley | 1,534 | 79.94% | 58 | 3.02% | 323 | 16.83% | 4 | 0.21% | 1,211 | 63.11% | 1,919 |
| Calhoun | 840 | 95.35% | 4 | 0.45% | 36 | 4.09% | 1 | 0.11% | 804 | 91.26% | 881 |
| Charleston | 10,603 | 76.32% | 562 | 4.05% | 2,660 | 19.15% | 68 | 0.49% | 7,943 | 57.17% | 13,893 |
| Cherokee | 1,075 | 61.15% | 77 | 4.38% | 605 | 34.41% | 1 | 0.06% | 470 | 26.73% | 1,758 |
| Chester | 1,527 | 75.89% | 48 | 2.39% | 436 | 21.67% | 1 | 0.05% | 1,091 | 54.22% | 2,012 |
| Chesterfield | 1,554 | 62.21% | 31 | 1.24% | 912 | 36.51% | 1 | 0.04% | 642 | 25.70% | 2,498 |
| Clarendon | 1,467 | 92.26% | 16 | 1.01% | 107 | 6.73% | 0 | 0.00% | 1,360 | 85.53% | 1,590 |
| Colleton | 2,337 | 89.92% | 39 | 1.50% | 223 | 8.58% | 0 | 0.00% | 2,114 | 81.14% | 2,599 |
| Darlington | 1,930 | 69.93% | 104 | 3.77% | 726 | 26.30% | 0 | 0.00% | 1,204 | 43.63% | 2,760 |
| Dillon | 967 | 53.72% | 24 | 1.33% | 808 | 44.89% | 1 | 0.06% | 159 | 8.83% | 1,800 |
| Dorchester | 2,717 | 92.10% | 85 | 2.88% | 143 | 4.85% | 5 | 0.17% | 2,574 | 87.25% | 2,950 |
| Edgefield | 1,797 | 98.20% | 6 | 0.33% | 27 | 1.48% | 0 | 0.00% | 1,770 | 96.72% | 1,830 |
| Fairfield | 1,073 | 79.54% | 63 | 4.67% | 211 | 15.64% | 2 | 0.15% | 862 | 63.90% | 1,349 |
| Florence | 3,729 | 72.97% | 192 | 3.76% | 1,189 | 23.27% | 0 | 0.00% | 2,540 | 49.71% | 5,110 |
| Georgetown | 1,943 | 78.66% | 92 | 3.72% | 432 | 17.49% | 3 | 0.12% | 1,511 | 61.17% | 2,470 |
| Greenville | 5,922 | 62.51% | 789 | 8.33% | 2,745 | 28.97% | 18 | 0.19% | 3,177 | 33.53% | 9,474 |
| Greenwood | 2,508 | 83.21% | 63 | 2.09% | 440 | 14.60% | 3 | 0.10% | 2,068 | 68.61% | 3,014 |
| Hampton | 1,530 | 94.33% | 10 | 0.62% | 81 | 4.99% | 1 | 0.06% | 1,449 | 89.33% | 1,622 |
| Horry | 3,345 | 84.45% | 113 | 2.85% | 503 | 12.70% | 0 | 0.00% | 2,842 | 71.75% | 3,961 |
| Jasper | 715 | 80.61% | 31 | 3.49% | 141 | 15.90% | 0 | 0.00% | 574 | 64.71% | 887 |
| Kershaw | 1,615 | 82.15% | 49 | 2.49% | 302 | 15.36% | 0 | 0.00% | 1,313 | 66.79% | 1,966 |
| Lancaster | 1,649 | 65.07% | 30 | 1.18% | 855 | 33.74% | 0 | 0.00% | 794 | 31.33% | 2,534 |
| Laurens | 2,047 | 77.86% | 69 | 2.62% | 513 | 19.51% | 0 | 0.00% | 1,534 | 58.35% | 2,629 |
| Lee | 1,155 | 86.65% | 36 | 2.70% | 142 | 10.65% | 0 | 0.00% | 1,013 | 75.99% | 1,333 |
| Lexington | 2,237 | 78.19% | 58 | 2.03% | 566 | 19.78% | 0 | 0.00% | 1,671 | 58.41% | 2,861 |
| Marion | 1,219 | 79.47% | 14 | 0.91% | 301 | 19.62% | 0 | 0.00% | 918 | 59.84% | 1,534 |
| Marlboro | 1,083 | 73.23% | 41 | 2.77% | 354 | 23.94% | 1 | 0.07% | 729 | 49.29% | 1,479 |
| McCormick | 713 | 95.96% | 0 | 0.00% | 30 | 4.04% | 0 | 0.00% | 683 | 91.92% | 743 |
| Newberry | 2,758 | 87.25% | 47 | 1.49% | 349 | 11.04% | 7 | 0.22% | 2,409 | 76.21% | 3,161 |
| Oconee | 1,155 | 59.02% | 135 | 6.90% | 666 | 34.03% | 1 | 0.05% | 489 | 24.99% | 1,957 |
| Orangeburg | 3,160 | 83.98% | 164 | 4.36% | 435 | 11.56% | 4 | 0.11% | 2,725 | 72.42% | 3,763 |
| Pickens | 1,344 | 69.14% | 165 | 8.49% | 435 | 22.38% | 0 | 0.00% | 909 | 46.76% | 1,944 |
| Richland | 6,096 | 66.32% | 670 | 7.29% | 2,419 | 26.32% | 7 | 0.08% | 3,677 | 40.00% | 9,192 |
| Saluda | 1,712 | 89.45% | 15 | 0.78% | 187 | 9.77% | 0 | 0.00% | 1,525 | 79.68% | 1,914 |
| Spartanburg | 4,660 | 38.70% | 627 | 5.21% | 6,741 | 55.98% | 13 | 0.11% | -2,081 | -17.28% | 12,041 |
| Sumter | 2,718 | 78.17% | 154 | 4.43% | 605 | 17.40% | 0 | 0.00% | 2,113 | 60.77% | 3,477 |
| Union | 2,090 | 61.13% | 46 | 1.35% | 1,283 | 37.53% | 0 | 0.00% | 807 | 23.60% | 3,419 |
| Williamsburg | 1,839 | 92.46% | 23 | 1.16% | 126 | 6.33% | 1 | 0.05% | 1,713 | 86.12% | 1,989 |
| York | 1,983 | 55.67% | 167 | 4.69% | 1,412 | 39.64% | 0 | 0.00% | 571 | 16.03% | 3,562 |
| Totals | 102,607 | 71.97% | 5,386 | 3.78% | 34,423 | 24.14% | 154 | 0.11% | 68,184 | 47.82% | 142,570 |
Counties that flipped from Democratic to Dixiecrat
- Florence
- Horry
- McCormick
- Marlboro
- Abbeville
- Barnwell
- Cherokee
- Chester
- Chesterfield
- Darlington
- Dillon
- Greenwood
- Lancaster
- Laurens
- Oconee
- Saluda
- Union
- York
- Aiken
- Allendale
- Bamberg
- Beaufort
- Berkeley
- Charleston
- Calhoun
- Clarendon
- Colleton
- Dorchester
- Edgefield
- Fairfield
- Greenville
- Georgetown
- Hampton
- Jasper
- Kershaw
- Lexington
- Lee
- Marion
- Newberry
- Orangeburg
- Pickens
- Richland
- Sumter
- Williamsburg
Analysis
Thurmond won his native state by a margin of 47.83 points, making him the first third-party candidate to carry the state since Southern Democrat John C. Breckinridge in 1860. This was the first time the state voted against the Democrats since 1876, and Truman was the first Democrat to win without the state since 1836.
Significant opposition to Thurmond came from the poor whites of the industrial upcountry, who rejected the Dixiecrats' opposition to public works and labor regulation. Many upcountry county parties and newspapers, especially in the two counties that backed Truman over Thurmond, alongside Senator Olin D. Johnston, also rejected bolting from the national party.
However, sufficiently few of these poorer whites voted that Thurmond was able to easily carry South Carolina, winning 44 of the state's 46 counties and over 71 percent of the total presidential vote. Thurmond exceeded 72 percent in all but twelve counties, and passed ninety percent in ten. This was the first time any county in South Carolina had voted against the national Democrats since 1900.
See also
Notes
- Because Thurmond was the official Democratic nominee in South Carolina and he and Truman came in the first two places in all counties and the state as a whole, all margins given are Thurmond vote minus Truman vote and all percentage margins Thurmond percentage minus Truman percentage.
References
- Key; Southern Politics in State and Nation, p. 332
- Phillips, Kevin P. (November 23, 2014). The Emerging Republican Majority. Princeton University Press. pp. 208, 210. ISBN 9780691163246.
- Mickey, Robert (February 19, 2015). Paths Out of Dixie: The Democratization of Authoritarian Enclaves in America's Deep South, 1944-1972. Princeton University Press. p. 440. ISBN 978-0691149639.
- Mickey; Paths Out of Dixie, p. 27
- Key junior, V.O. (1984). Southern Politics in State and Nation. University of Tennessee Press. p. 328. ISBN 087049435X.
- Scher, Richard K. (December 31, 1996). Politics in the New South: Republicanism, Race and Leadership in the Twentieth Century. M.E. Sharpe. p. 95. ISBN 1563248484.
- Frederickson, Kari A. (2001). The Dixiecrat Revolt and the End of the Solid South, 1932-1968. Univ of North Carolina Press. p. 39. ISBN 0807849103.
- Geselbracht, Raymond H., ed. (2007). The Civil Rights Legacy of Harry S. Truman. Truman State University Press. p. 53. ISBN 978-1931112673.
- Fredericksen. The Dixiecrat Revolt and the End of the Solid South, p. 52
- Sabato, Larry J.; Ernst, Howard R. (2014). Encyclopedia of American Political Parties and Elections. Facts On File. p. 114. ISBN 9781438141817.
- Key. Southern Politics in State and Nation, p. 332
- Mickey. Paths Out of Dixie, pp. 146-149
- Black & Black 1992, p. 147.
- Gallup, George (September 12, 1948). "Thurmond's Long South Carolina Lead Highlights Democratic Problem in Dixie". The Herald-Sun. Durham, North Carolina. p. 1.
- Gallup, George (October 15, 1948). "Only Four States Go to Dixiecrats". Chattanooga Daily Times. Chattanooga, Tennessee. p. 6-A.
- Lincoln, Gould (October 20, 1948). "States' Rights Party Sews Up South Carolina for Thurmond". The Evening Star. Washington, D.C. p. A—5.
- Montgomery, John A. (October 24, 1948). "South Carolina". The Montgomery Advertiser. Montgomery, Alabama. p. 16.
- Tucker, Ray (November 1, 1948). "Truman Whistling in a White House Graveyard, Says Tucker, Predicting It'll Be a Dewey Sweep". Mount Vernon Argus. Mount Vernon, New York. p. 8.
- Gallup, George (November 1, 1948). "Final Gallup Poll Shows Dewey Winning Election with Wide Electoral Vote Margin". Oakland Tribune. Oakland, California. pp. 1–2.
- "1948 Presidential General Election Results – South Carolina". U.S. Election Atlas. Retrieved December 23, 2013.
- Scammon, Richard M. (compiler); America at the Polls: A Handbook of Presidential Election Statistics 1920-1964; p. 395 ISBN 0405077114
- "Popular Vote for Strom Thurmond". Géoelections. (.xlsx file for €15)
- Phillips. The Emerging Republican Majority; pp. 262-265
- "Thurmond Winner: State Out of Demo Column for First Time Since 1876". Anderson Independent-Mail. Anderson, South Carolina. p. 1.
- "Johnson Openly Bucks Thurmond". The Item. Sumter, South Carolina. p. 11.
- Menendez, Albert J. (2005). The Geography of Presidential Elections in the United States, 1868-2004. Jefferson, North Carolina: McFarland & Company. pp. 291–293. ISBN 0786422173.
Works cited
- Black, Earl; Black, Merle (1992). The Vital South: How Presidents Are Elected. Harvard University Press. ISBN 0674941306.
| Elections in South Carolina | |
|---|---|
| General |
|
| State Senate | |
| State House | |
| Governor | |
| U.S. President | |
| U.S. Senate |
|
| U.S. House |
|
| See also: Political party strength in South Carolina | |
| State and district results of the 1948 United States presidential election | ||
|---|---|---|
|  | |


