Main article: 1948 United States presidential election
1948 United States presidential election in Louisiana Louisiana votes to the Electoral College
Thurmond
40-50%
50-60%
60-70%
70-80%
90-100%
Truman
30-40%
40-50%
50-60%
60-70%
Dewey
40-50%
The 1948 United States presidential election in Louisiana took place on November 2, 1948, as part of the 1948 United States presidential election . State voters chose ten representatives, or electors, to the Electoral College , who voted for president and vice president .
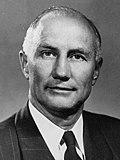
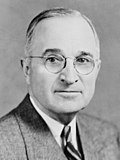
Louisiana was won by Governor Strom Thurmond (DX –South Carolina ), running with Governor Fielding L. Wright , with 49.07% of the popular vote, against incumbent President Harry S. Truman (D –Missouri ), running with Senator Alben W. Barkley , with 32.75% of the popular vote, and Governor Thomas E. Dewey (R –New York ), running with Governor Earl Warren , with 17.45% of the popular vote.
This marked the first time since 1876 that Louisiana failed to back the Democratic nominee in a presidential election, and the first time ever that a Democrat won the presidency without carrying the state.
52% of white voters supported Thurmond.
Results
Results by parish
Parish
Strom Thurmond
Harry S. Truman
Thomas E. Dewey
Henry A. Wallace
Margin
Total votes cast
#
%
#
%
#
%
#
%
#
%
Acadia
3,497
52.37%
2,382
35.67%
784
11.74%
14
0.21%
1,115
16.70%
6,678
Allen
980
30.44%
1,996
62.01%
241
7.49%
2
0.06%
-1,016
-31.57%
3,219
Ascension
1,420
47.60%
1,126
37.75%
433
14.52%
4
0.13%
294
9.85%
2,983
Assumption
1,000
54.53%
362
19.74%
469
25.57%
3
0.16%
531
28.96%
1,834
Avoyelles
5,417
76.24%
1,356
19.09%
285
4.01%
44
0.62%
4,061
57.15%
7,105
Beauregard
1,365
39.30%
1,653
47.60%
449
12.93%
6
0.17%
-288
-8.30%
3,473
Bienville
2,362
79.34%
421
14.14%
191
6.42%
3
0.10%
1,941
65.20%
2,977
Bossier
2,390
61.66%
1,147
29.59%
338
8.72%
1
0.03%
1,243
32.07%
3,876
Caddo
11,292
51.06%
5,985
27.06%
4,777
21.60%
63
0.28%
5,307
24.00%
22,117
Calcasieu
3,400
27.34%
7,074
56.87%
1,940
15.60%
24
0.19%
-3,674
-29.53%
12,438
Caldwell
818
46.80%
777
44.45%
151
8.64%
2
0.11%
41
2.35%
1,748
Cameron
293
26.09%
742
66.07%
87
7.75%
1
0.09%
-449
-39.98%
1,123
Catahoula
1,062
63.75%
515
30.91%
86
5.16%
3
0.18%
547
32.84%
1,666
Claiborne
2,061
73.98%
457
16.40%
265
9.51%
3
0.11%
1,604
57.58%
2,786
Concordia
1,140
72.75%
329
21.00%
98
6.25%
0
0.00%
811
51.75%
1,567
DeSoto
1,889
68.00%
617
22.21%
270
9.72%
2
0.07%
1,272
45.79%
2,778
East Baton Rouge
8,166
38.05%
8,560
39.88%
4,585
21.36%
153
0.71%
-394
-1.83%
21,464
East Carroll
663
60.05%
323
29.26%
116
10.51%
2
0.18%
340
30.79%
1,104
East Feliciana
839
67.99%
267
21.64%
127
10.29%
1
0.08%
572
46.35%
1,234
Evangeline
4,415
76.48%
1,149
19.90%
206
3.57%
3
0.05%
3,266
56.58%
5,773
Franklin
1,872
48.19%
1,857
47.80%
149
3.84%
7
0.18%
15
0.39%
3,885
Grant
1,439
50.67%
1,120
39.44%
273
9.61%
8
0.28%
319
11.23%
2,840
Iberia
2,224
36.12%
1,015
16.49%
2,910
47.26%
8
0.13%
-686
-11.14%
6,157
Iberville
856
27.91%
1,697
55.33%
506
16.50%
8
0.26%
-841
-27.42%
3,067
Jackson
1,400
61.16%
713
31.15%
169
7.38%
7
0.31%
687
30.01%
2,289
Jefferson
8,822
54.56%
4,654
28.79%
2,620
16.20%
72
0.45%
4,168
25.77%
16,168
Jefferson Davis
1,122
30.82%
1,717
47.16%
793
21.78%
9
0.25%
-595
-16.34%
3,641
Lafayette
3,724
49.01%
1,787
23.52%
2,068
27.21%
20
0.26%
1,656
21.80%
7,599
Lafourche
3,052
51.62%
1,586
26.82%
1,247
21.09%
28
0.47%
1,466
24.80%
5,913
LaSalle
1,767
64.23%
716
26.03%
266
9.67%
2
0.07%
1,051
38.20%
2,751
Lincoln
2,196
68.60%
625
19.53%
353
11.03%
27
0.84%
1,571
49.07%
3,201
Livingston
1,351
38.92%
1,841
53.04%
264
7.61%
15
0.43%
-490
-14.12%
3,471
Madison
1,033
75.62%
197
14.42%
127
9.30%
9
0.66%
836
61.20%
1,366
Morehouse
1,391
49.43%
1,177
41.83%
242
8.60%
4
0.14%
214
7.60%
2,814
Natchitoches
2,887
53.94%
1,692
31.61%
763
14.26%
10
0.19%
1,195
22.33%
5,352
Orleans
50,234
40.58%
41,900
33.85%
29,442
23.78%
2,203
1.78%
8,334
6.73%
123,785
Ouachita
4,848
44.88%
4,213
39.00%
1,729
16.01%
12
0.11%
635
5.88%
10,802
Plaquemines
2,597
93.62%
77
2.78%
90
3.24%
10
0.36%
2,507
90.38%
2,774
Pointe Coupee
1,375
69.48%
402
20.31%
198
10.01%
4
0.20%
973
49.17%
1,979
Rapides
6,581
50.39%
4,730
36.22%
1,707
13.07%
42
0.32%
1,851
14.17%
13,060
Red River
1,535
72.89%
452
21.46%
113
5.37%
6
0.28%
1,083
51.43%
2,106
Richland
1,448
57.12%
960
37.87%
119
4.69%
8
0.32%
488
19.25%
2,535
Sabine
2,249
54.51%
1,405
34.05%
469
11.37%
3
0.07%
844
20.46%
4,126
St. Bernard
2,242
91.70%
91
3.72%
107
4.38%
5
0.20%
2,135
87.32%
2,445
St. Charles
1,206
50.04%
914
37.93%
286
11.87%
4
0.17%
292
12.11%
2,410
St. Helena
662
55.58%
469
39.38%
59
4.95%
1
0.08%
193
16.20%
1,191
St. James
800
37.79%
859
40.58%
453
21.40%
5
0.24%
-59
-2.79%
2,117
St. John the Baptist
695
36.97%
799
42.50%
379
20.16%
7
0.37%
-104
-5.53%
1,880
St. Landry
5,730
73.96%
1,179
15.22%
829
10.70%
9
0.12%
4,551
58.74%
7,747
St. Martin
2,822
73.80%
307
8.03%
688
17.99%
7
0.18%
2,134
55.81%
3,824
St. Mary
1,751
49.99%
918
26.21%
824
23.52%
10
0.29%
833
23.78%
3,503
St. Tammany
3,063
60.76%
1,164
23.09%
790
15.67%
24
0.48%
1,899
37.67%
5,041
Tangipahoa
3,919
52.90%
2,184
29.48%
1,287
17.37%
18
0.24%
1,735
23.42%
7,408
Tensas
732
70.05%
239
22.87%
72
6.89%
2
0.19%
493
47.18%
1,045
Terrebonne
2,011
46.40%
1,262
29.12%
1,048
24.18%
13
0.30%
749
17.28%
4,334
Union
1,872
65.50%
724
25.33%
259
9.06%
3
0.10%
1,148
40.17%
2,858
Vermilion
3,236
51.69%
1,806
28.85%
1,212
19.36%
7
0.11%
1,430
22.84%
6,261
Vernon
2,331
50.87%
1,939
42.32%
296
6.46%
16
0.35%
392
8.55%
4,582
Washington
4,141
53.08%
3,267
41.88%
371
4.76%
22
0.28%
874
11.20%
7,801
Webster
2,895
54.72%
1,933
36.53%
455
8.60%
8
0.15%
962
18.19%
5,291
West Baton Rouge
466
39.93%
557
47.73%
141
12.08%
3
0.26%
-91
-7.80%
1,167
West Carroll
1,221
53.16%
921
40.10%
151
6.57%
4
0.17%
300
13.06%
2,297
West Feliciana
377
64.78%
101
17.35%
102
17.53%
2
0.34%
275
47.25%
582
Winn
1,648
56.25%
940
32.08%
333
11.37%
9
0.31%
708
24.17%
2,930
Totals
204,290
49.07%
136,344
32.75%
72,657
17.45%
3,035
0.73%
67,946
16.32%
416,336
Parishes that flipped from Democratic to Dixiecrat
Parishes that flipped from Democratic to Republican
See also
Notes
write-in vote was recorded from this parish.
^
References
"United States Presidential election of 1948 - Encyclopædia Britannica" . Retrieved December 20, 2017.The Clarion-Ledger "1948 Election for the Forty-First Term (1949-53)" . Retrieved December 20, 2017."1948 Presidential General Election Results - Louisiana" . Retrieved December 20, 2017."The American Presidency Project - Election of 1948" . Retrieved December 20, 2017.Black & Black 1992 , p. 147.
"LA US President Race, November 02, 1948" . Our Campaigns.
Works cited
Categories :
Text is available under the Creative Commons Attribution-ShareAlike License. Additional terms may apply.
**DISCLAIMER** We are not affiliated with Wikipedia, and Cloudflare.
The information presented on this site is for general informational purposes only and does not constitute medical advice.
You should always have a personal consultation with a healthcare professional before making changes to your diet, medication, or exercise routine.
AI helps with the correspondence in our chat.
We participate in an affiliate program. If you buy something through a link, we may earn a commission 💕
↑
 Parish Results


